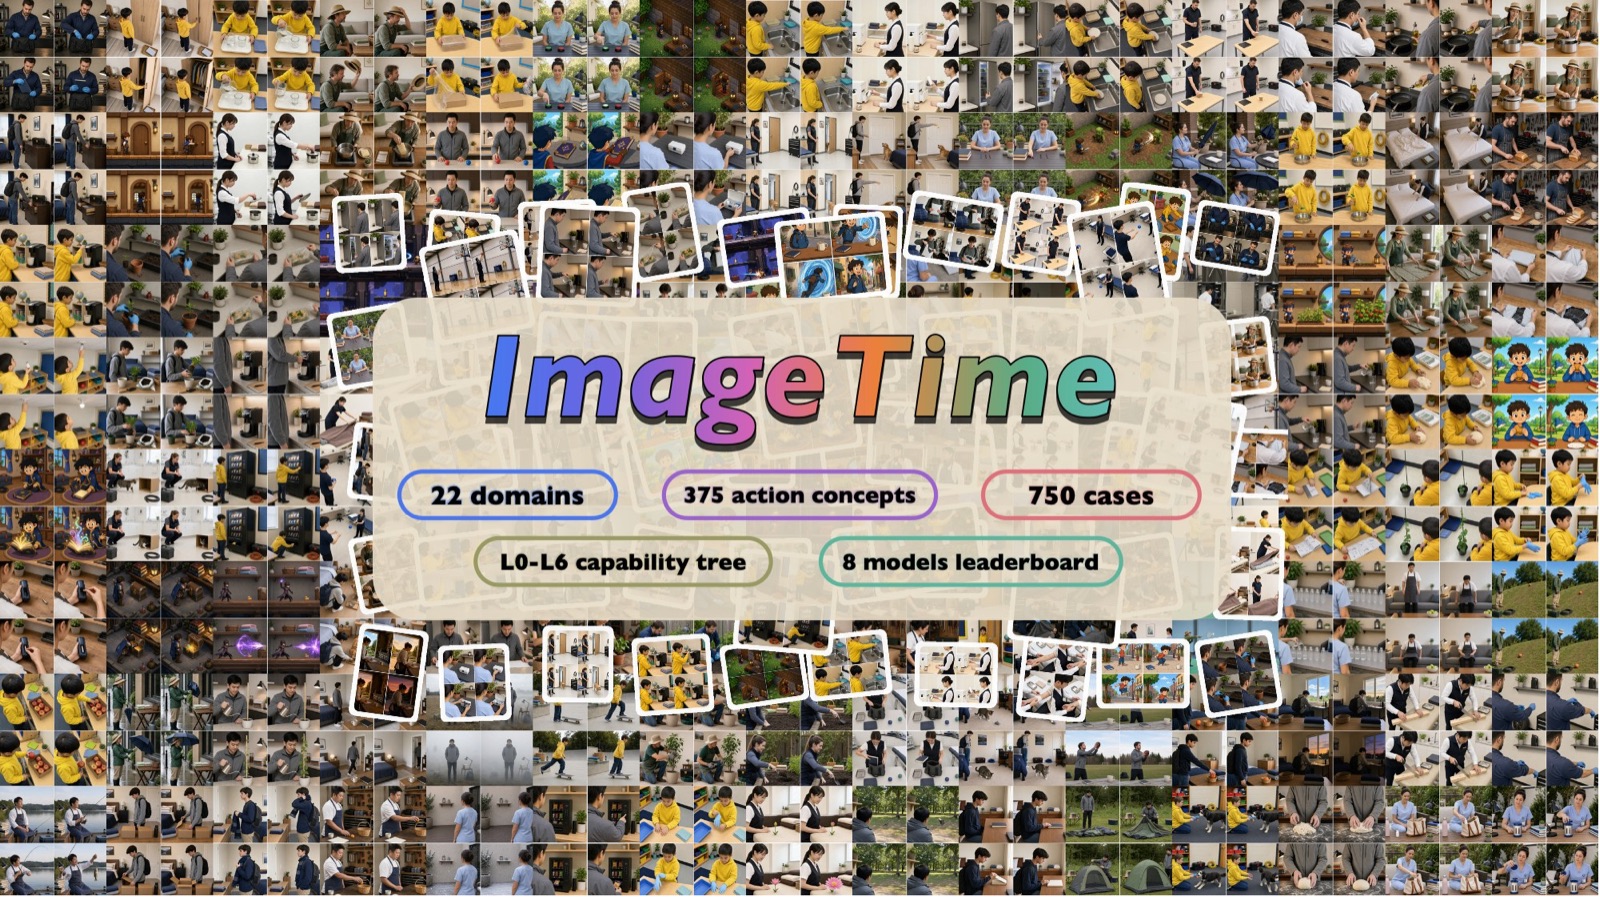
A diagnostic benchmark · visual world modeling
Image generators now paint stunning single frames — but can they hold a coherent visual world across multiple states in one picture? ImageTime asks a model to draw a single image of four ordered key states and probes whether identities, objects, spatial relations, and causal order survive over time.
The paper
The full preprint — no download required. Scroll through it below, or open it full-screen / save a copy from the toolbar.
The question
We've long assumed image models render how things look, and video models render how things change. This generation of image models is quietly blurring that line.
Ask a strong model to draw “open a drawer → reach in → take out an object” as four stages in one image, and it doesn't just paint four pretty pictures — it keeps the object from appearing in the hand before the drawer is open. In static pixels, it maintains a world with order and causality.
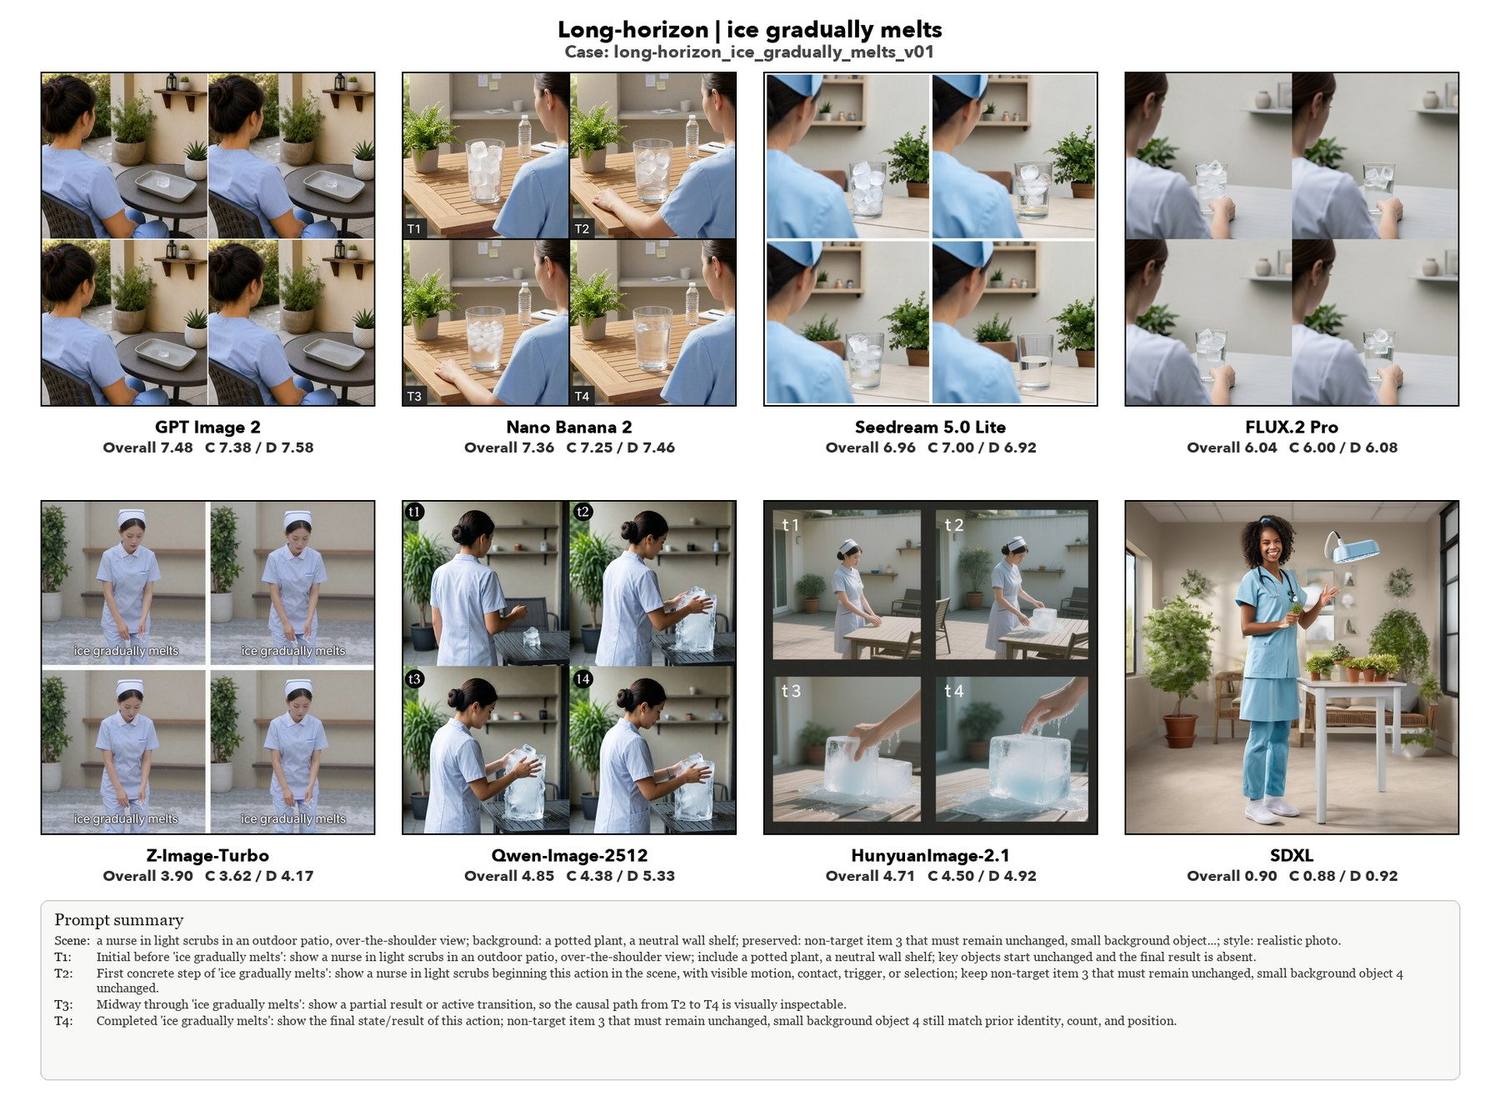
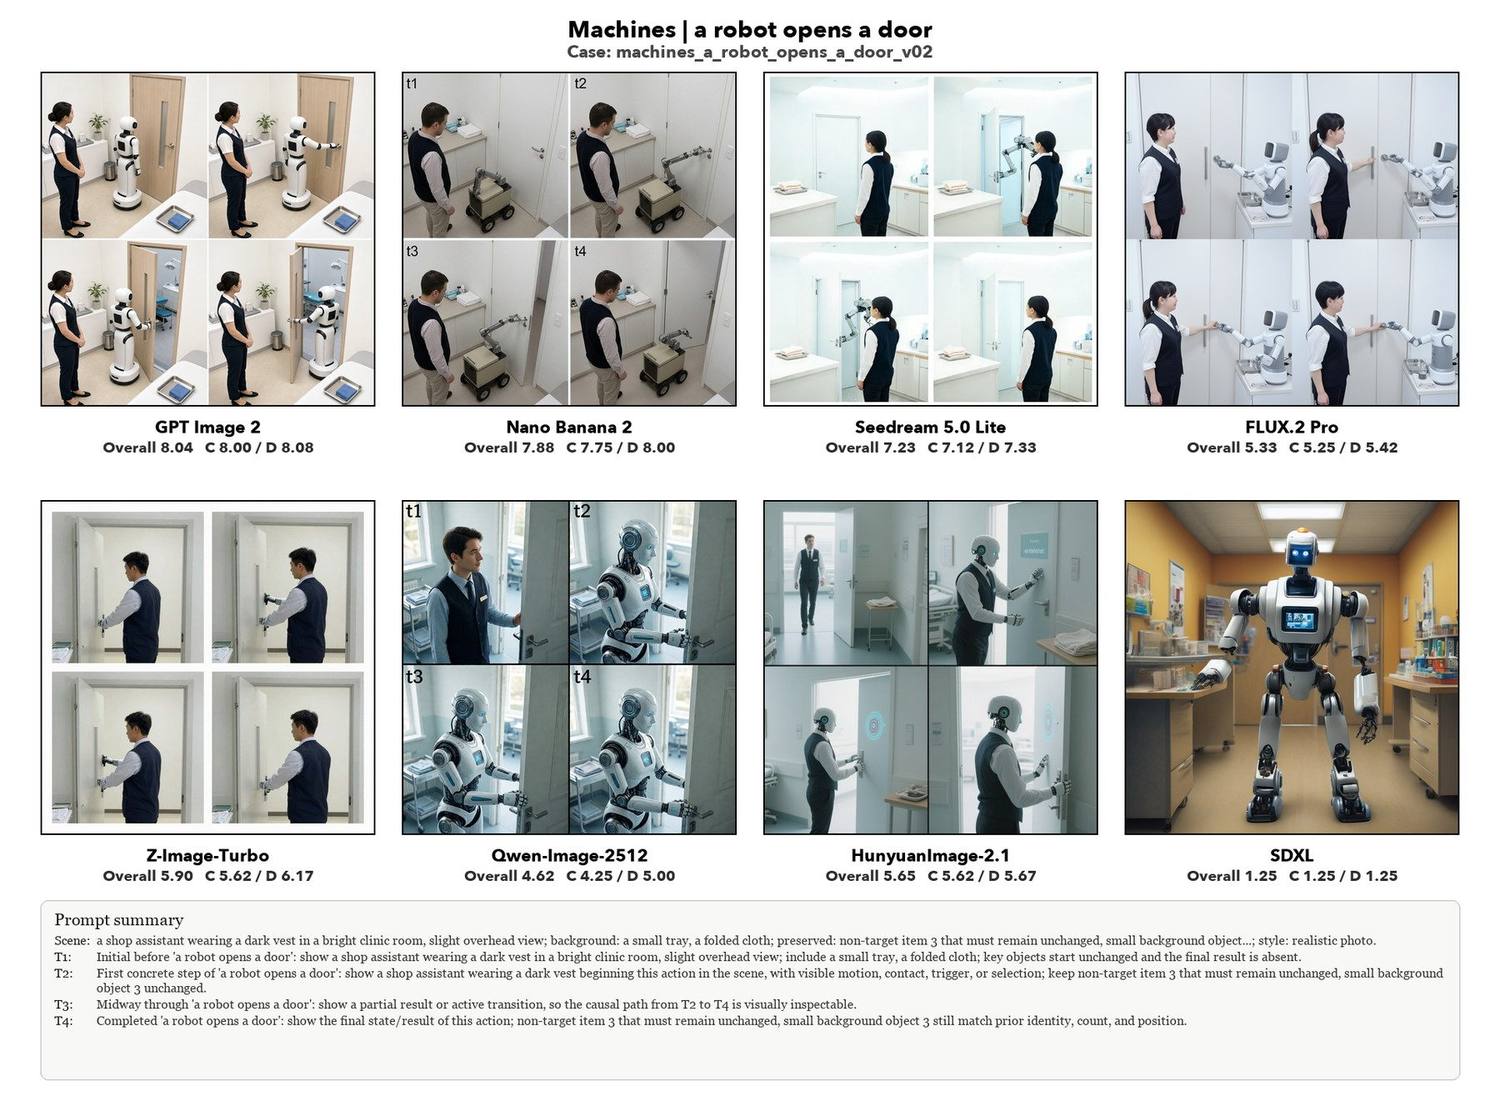
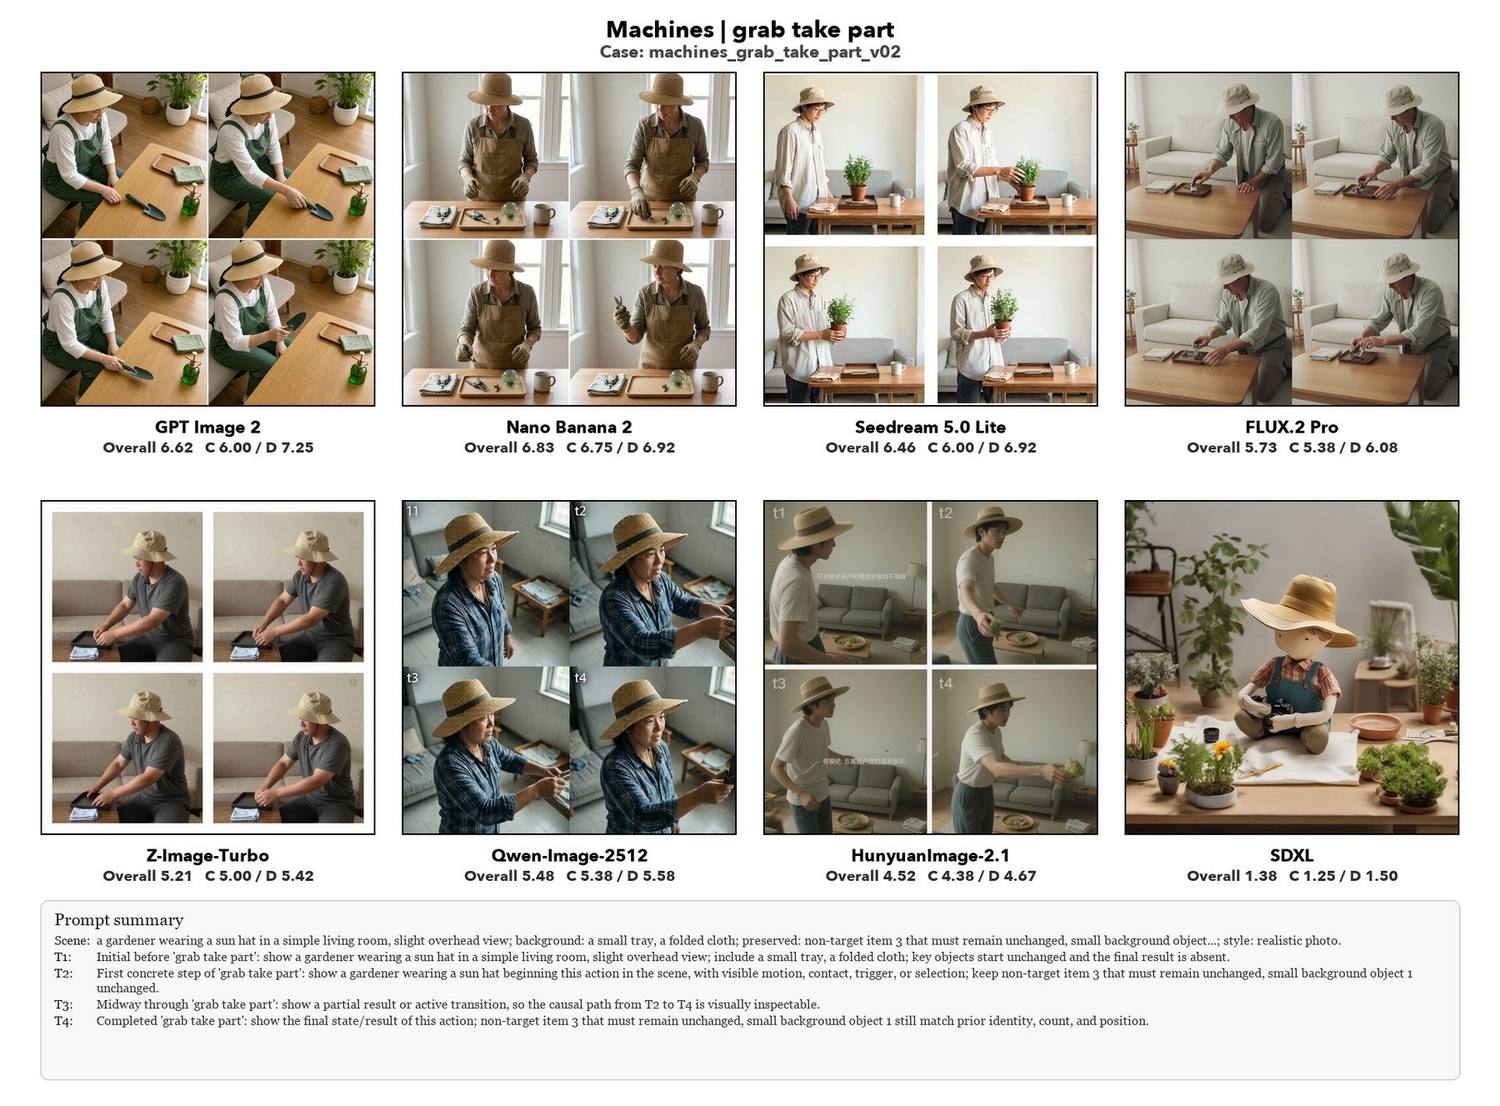
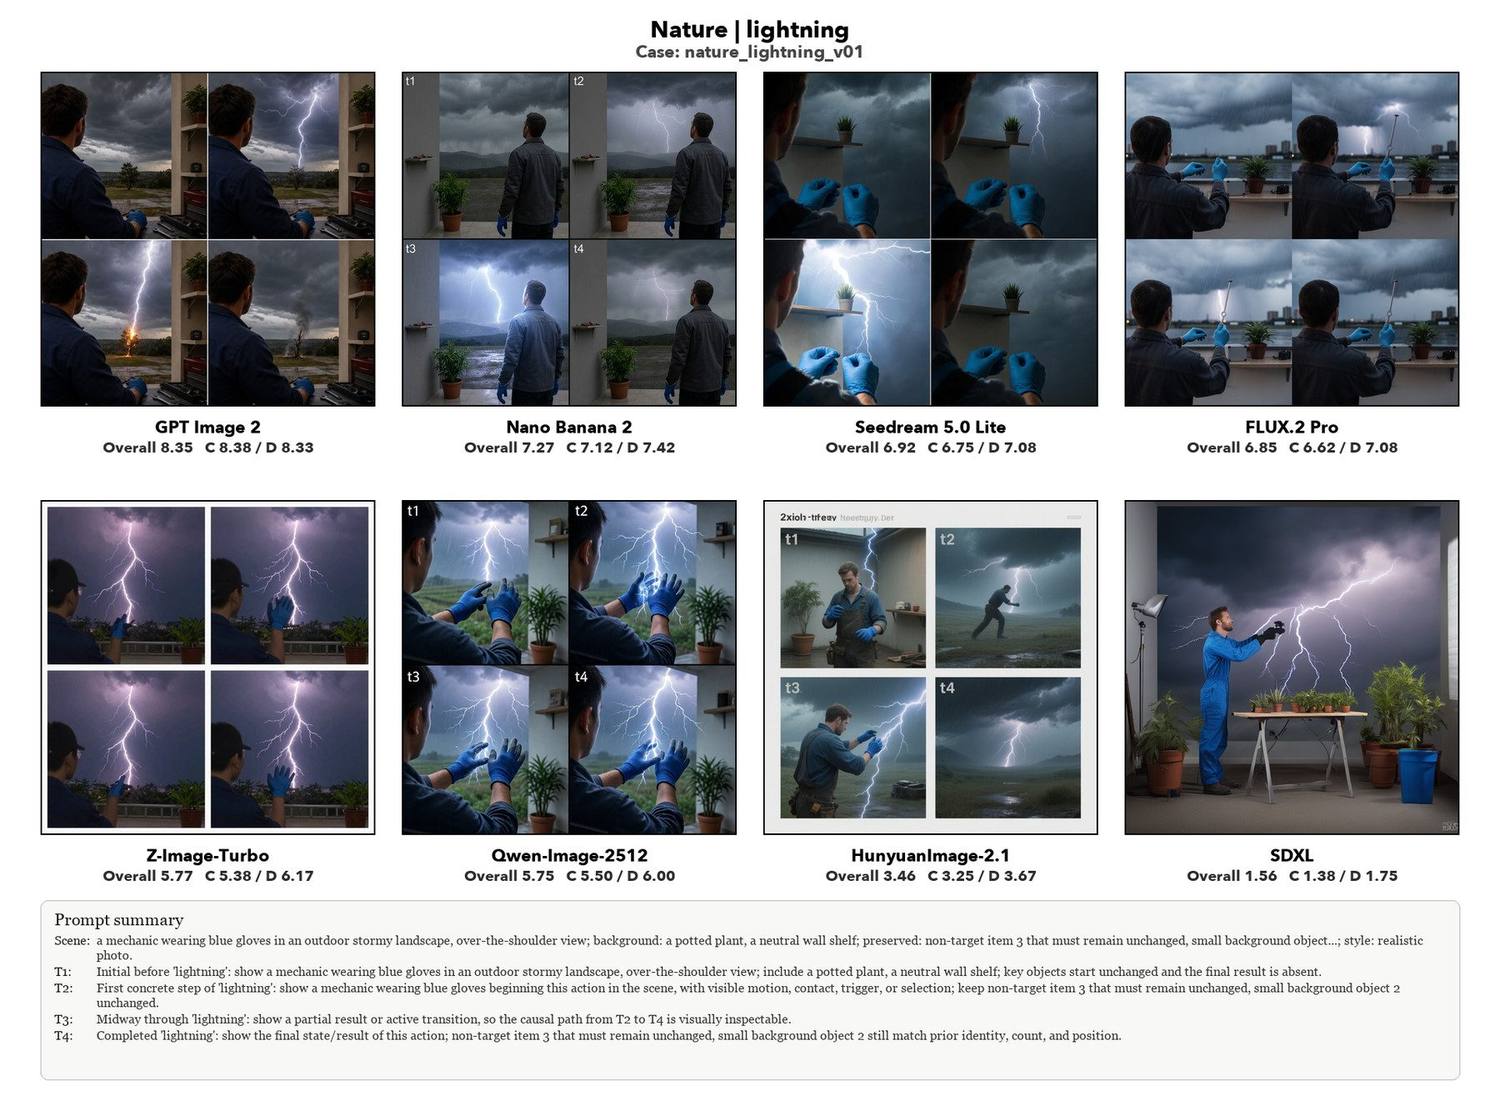
But existing text-to-image benchmarks mostly score a single image: right objects, attributes, counts, layout. The moment a task involves change over time, that lens is easy to fool — a model can jump straight to the result, copy-paste a frame, conjure objects from nowhere, or let an effect precede its cause. Each frame looks fine alone; only the ordered process exposes the failure.
So instead of generating dense video and evaluating that, ImageTime forces the model to draw time into one checkable static image.
The task
Given an action instruction — and optionally a reference image for the initial state — a model must produce a single image laid out as a 2×2 motion sheet:
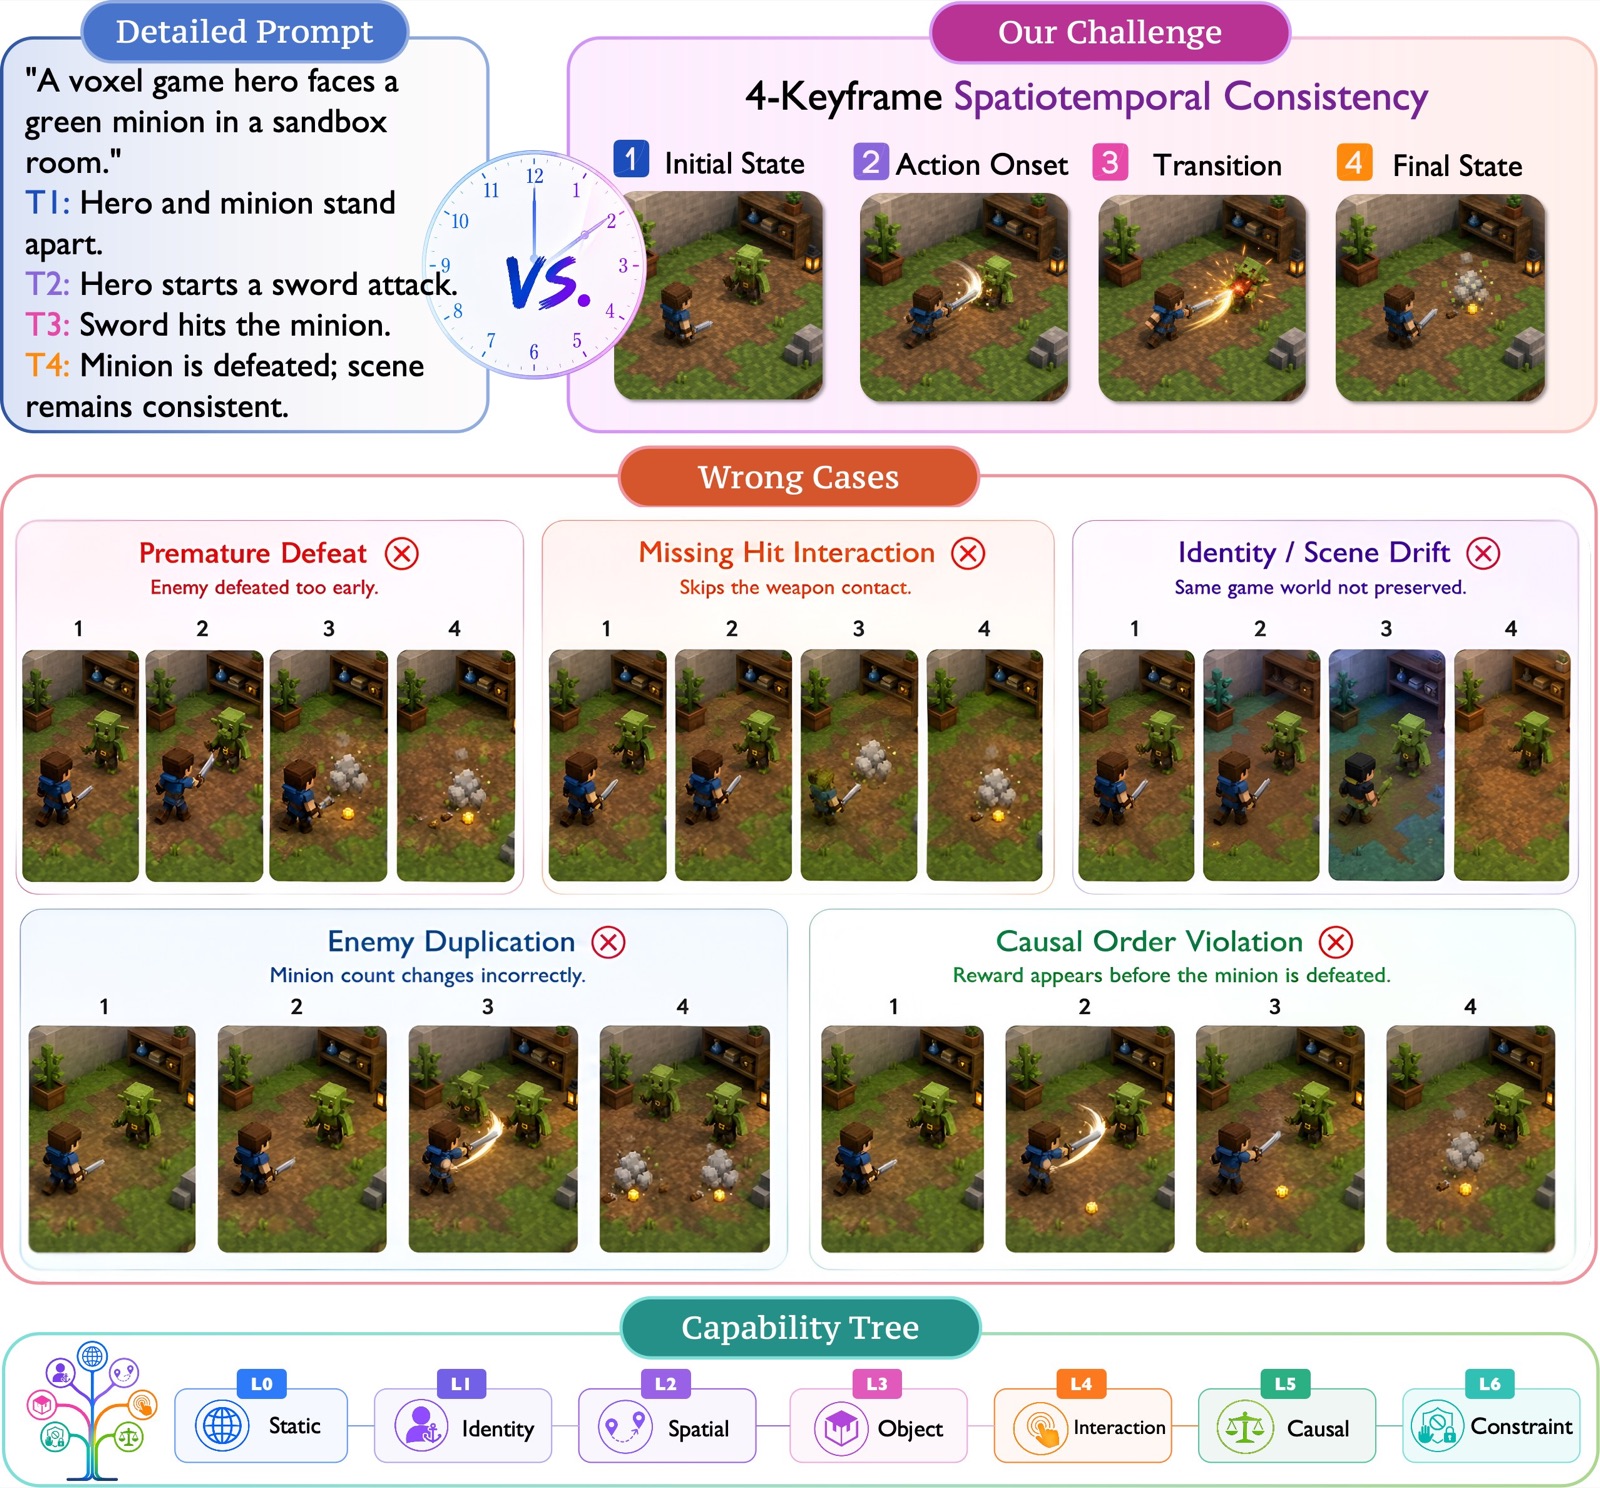
The outcome appears before the necessary actions ever happen.
The key interaction (the hit, the grasp, the touch) is skipped.
The subject's face, the background, or the camera silently changes.
Objects appear or vanish; quantities aren't conserved across frames.
A reward shows up before the event that should produce it.
How we score
Rather than one blurry total, ImageTime maps each scenario onto a progressive hierarchy where higher levels depend on the visual promises of lower ones — so you can see which level a model starts to fail.
low-level grounding → … → constrained, evolving causal worlds
Did the model do it? Layout, entity consistency, spatial coherence, motion continuity, temporal order, causality, interaction, constraint sensitivity, and image quality.
Why did it succeed or fail? Concrete visual evidence — is the transition visible, are counts conserved, is occlusion consistent — behind every judgement.
First validates the 2×2 layout, then parses each cell, then emits C/D scores, confidence, and failure labels — so a low score is traceable, not a black box.
Leaderboard · prompt-only
No reference image, single generation, no retries or human cherry-picking. Static scenes are easy; maintaining a constrained, evolving causal world is hard.
| Model | L0 | L1 | L2 | L3 | L4 | L5 | L6 |
|---|---|---|---|---|---|---|---|
| GPT Image 2 | 8.11 | 7.44 | 7.45 | 7.45 | 7.56 | 7.62 | 7.28 |
| Nano Banana 2 | 7.66 | 7.00 | 7.19 | 7.10 | 7.30 | 7.46 | 5.83 |
| Seedream 5.0 Lite | 7.55 | 6.71 | 6.67 | 6.62 | 6.82 | 6.73 | 6.73 |
| FLUX.2 Pro | 6.93 | 6.54 | 5.64 | 5.18 | 5.35 | 4.48 | 4.52 |
| Qwen-Image-2512 | 6.35 | 5.94 | 4.86 | 4.63 | 4.93 | 3.60 | 1.21 |
| Z-Image-Turbo | 6.35 | 6.48 | 4.96 | 4.55 | 4.55 | 3.29 | 1.44 |
| HunyuanImage-2.1 | 5.64 | 4.54 | 4.39 | 4.03 | 4.74 | 3.79 | 1.20 |
| SDXL | 2.99 | 2.13 | 1.21 | 1.37 | 1.26 | 0.49 | 0.61 |
Tree-level scores (L0 Static → L6 Constraint), prompt-only — the exact numbers behind the degradation curve. Note how every model except GPT Image 2 and Seedream drops sharply at L6.
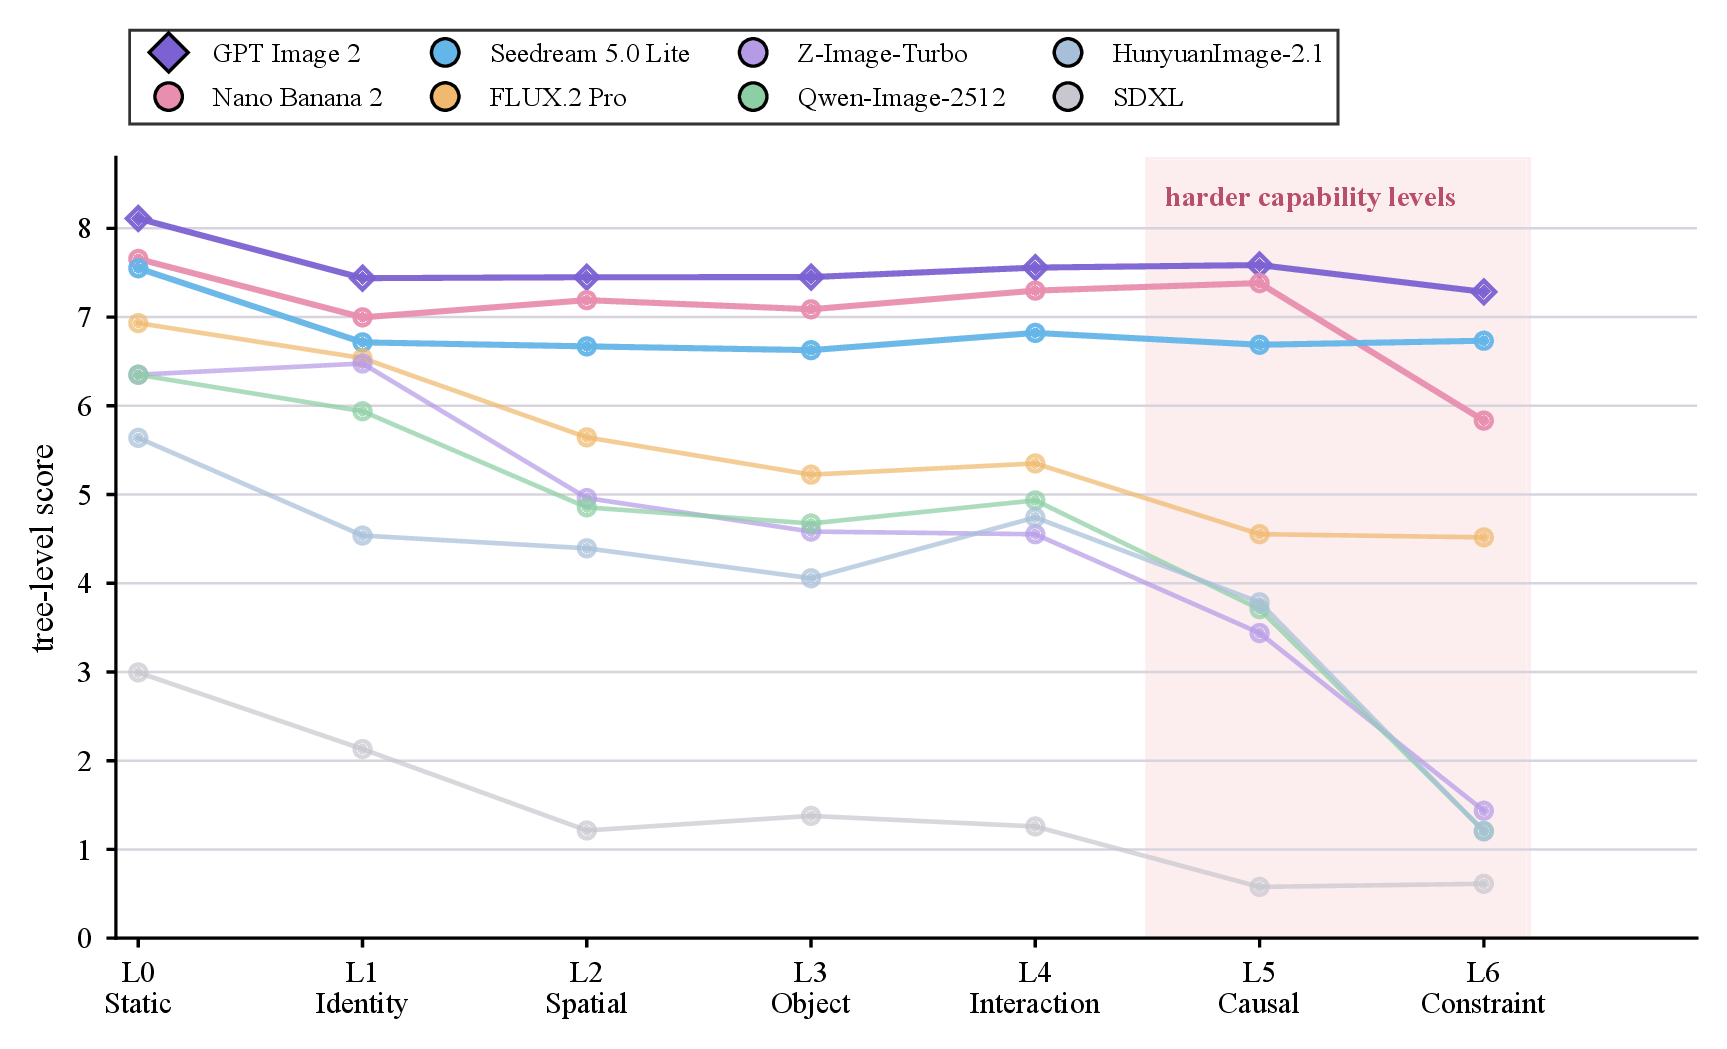
From static grounding (L0) to constraint reasoning (L6). The strongest models stay flat; weaker ones show clear upper-tree collapse — causality and constraints are where things break.
Many models keep high image quality (C9) while motion continuity, temporal order and causality (C4–C6) collapse. We never let pretty pixels compensate for missing causality.
Open models without explicit chain-of-thought (Qwen-Image, Z-Image) still show non-trivial entity preservation, spatial anchoring and ordered state change. They trail the best — but they're in the race.
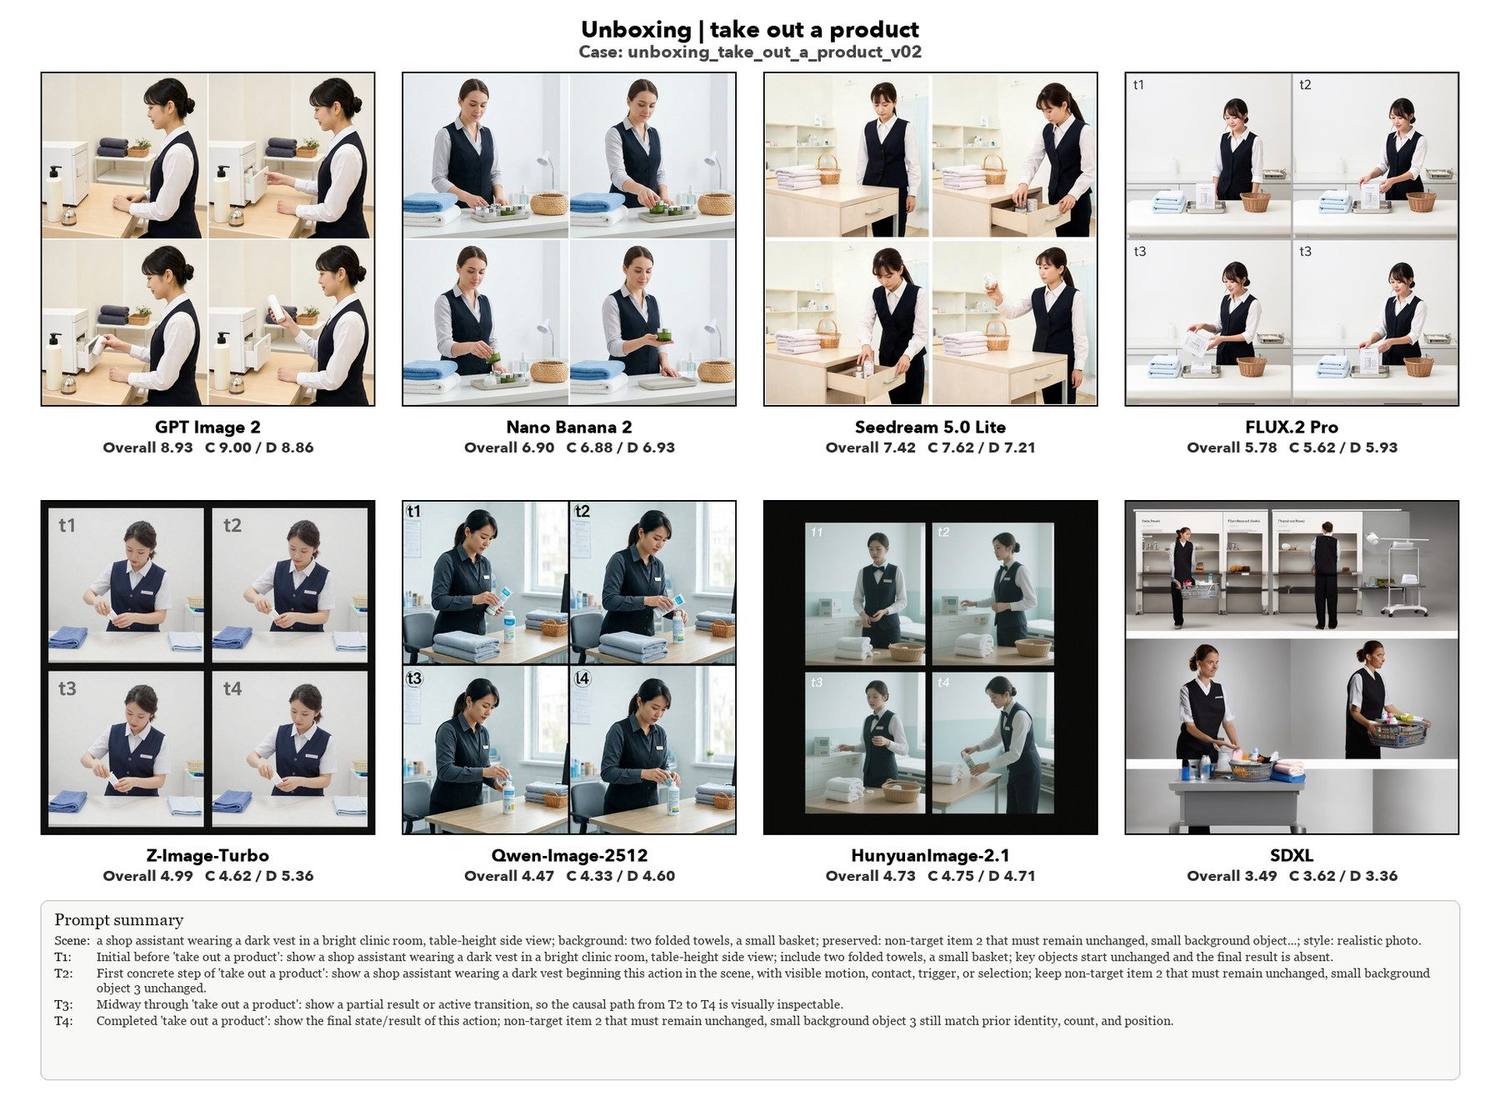
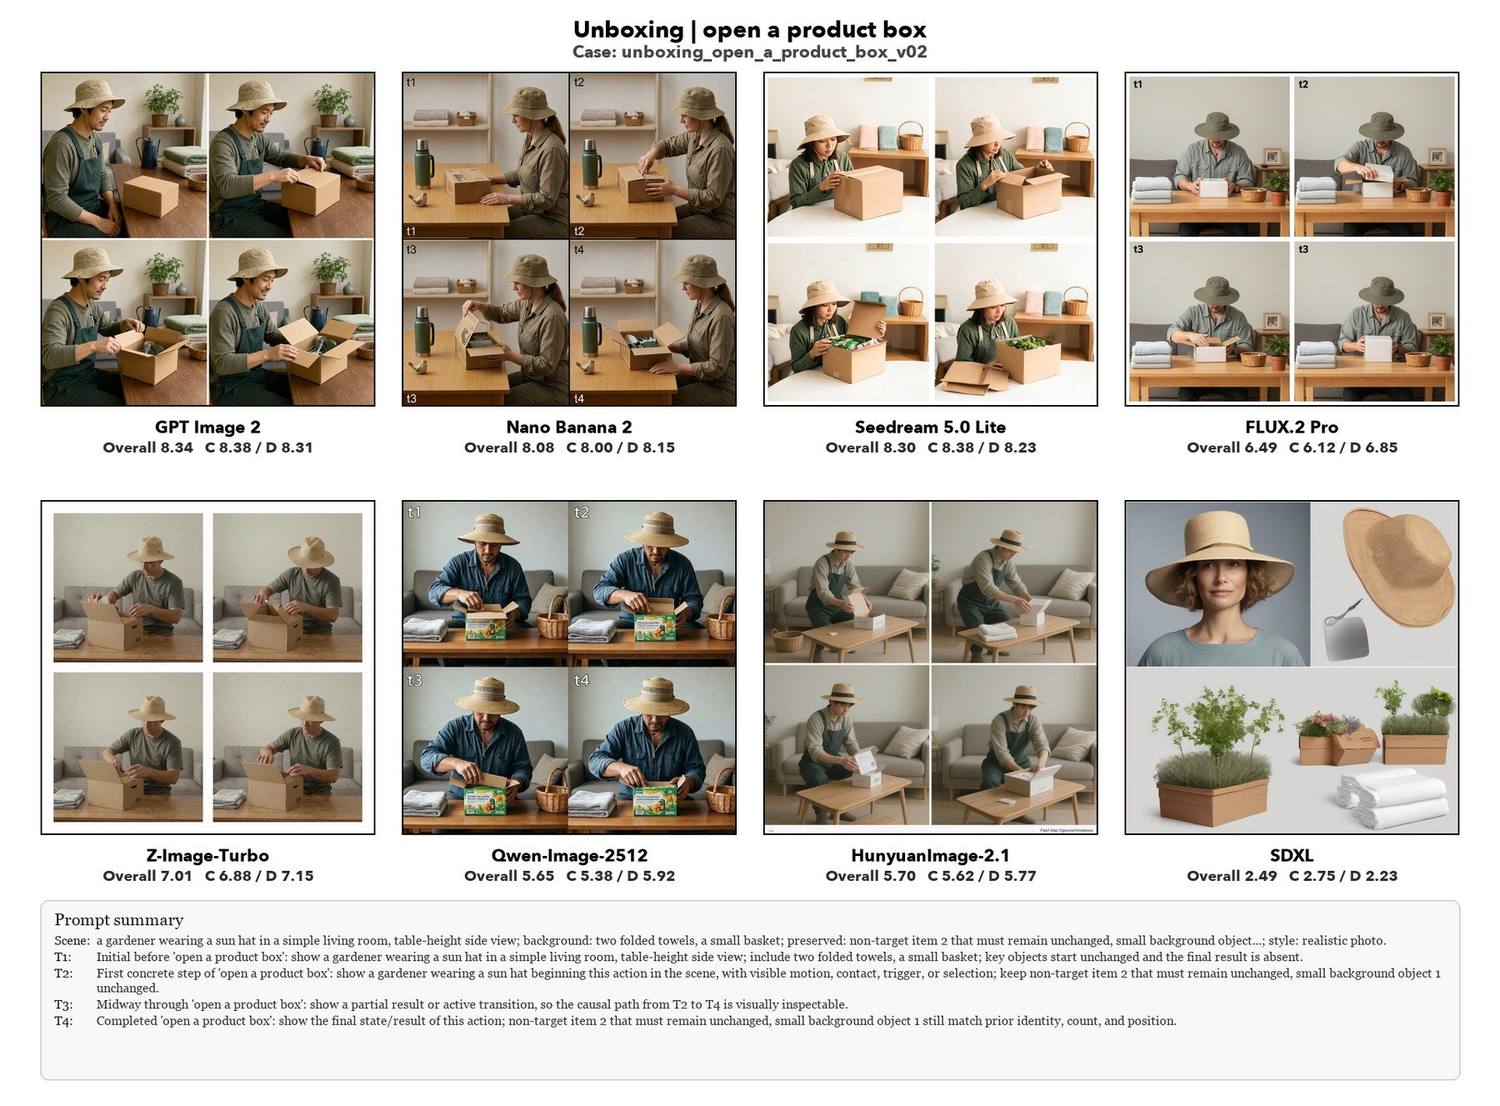
Almost every weaker model degrades upward: building a static scene is easy; sustaining a constrained, evolving causal world is hard. Failures recur — drift, missing mid-states, premature endings.
Deeper analysis
Beyond a single ranking, the structured judge yields capability profiles, per-diagnostic breakdowns, score distributions, cost trade-offs and domain-level maps. The headline numbers sit on the left; flip through the supporting figures in the viewer below.
| Model | C mean | D mean | Overall |
|---|---|---|---|
| 1GPT Image 2 | 7.86 | 7.87 | 7.86 |
| 2Nano Banana 2 | 7.43 | 7.47 | 7.45 |
| 3Seedream 5.0 Lite | 7.13 | 7.20 | 7.16 |
| 4FLUX.2 Pro | 5.92 | 6.28 | 6.10 |
| 5Z-Image-Turbo | 5.14 | 5.69 | 5.41 |
| 6Qwen-Image-2512 | 5.09 | 5.55 | 5.32 |
| 7HunyuanImage-2.1 | 4.91 | 5.04 | 4.98 |
| 8SDXL | 1.49 | 1.64 | 1.57 |
Mean capability (C), diagnostic (D) and overall scores over all 750 cases. Cell shading runs warm (strong) → cool (weak).
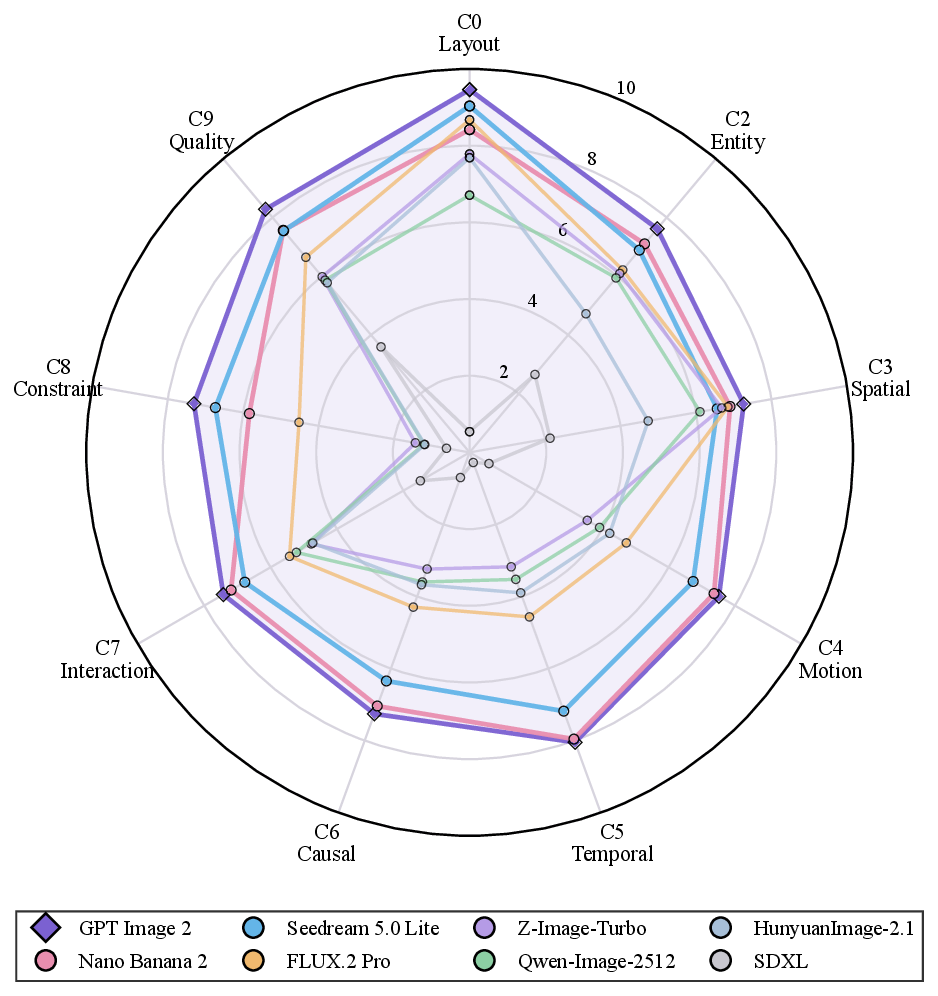
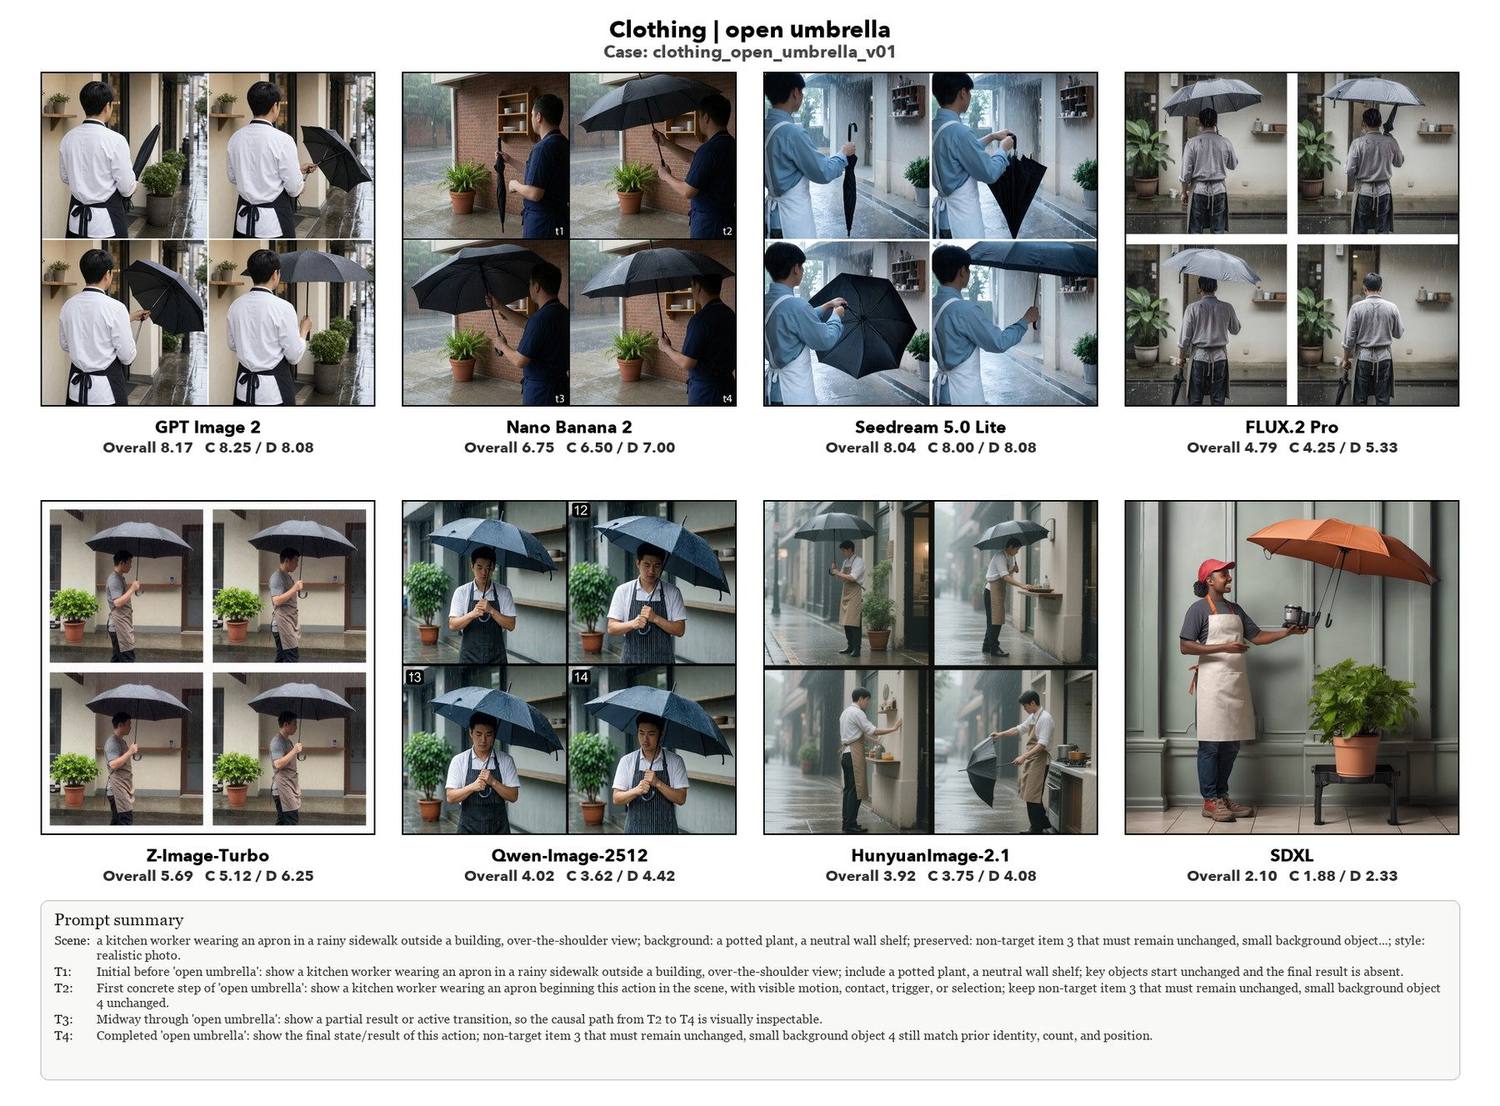
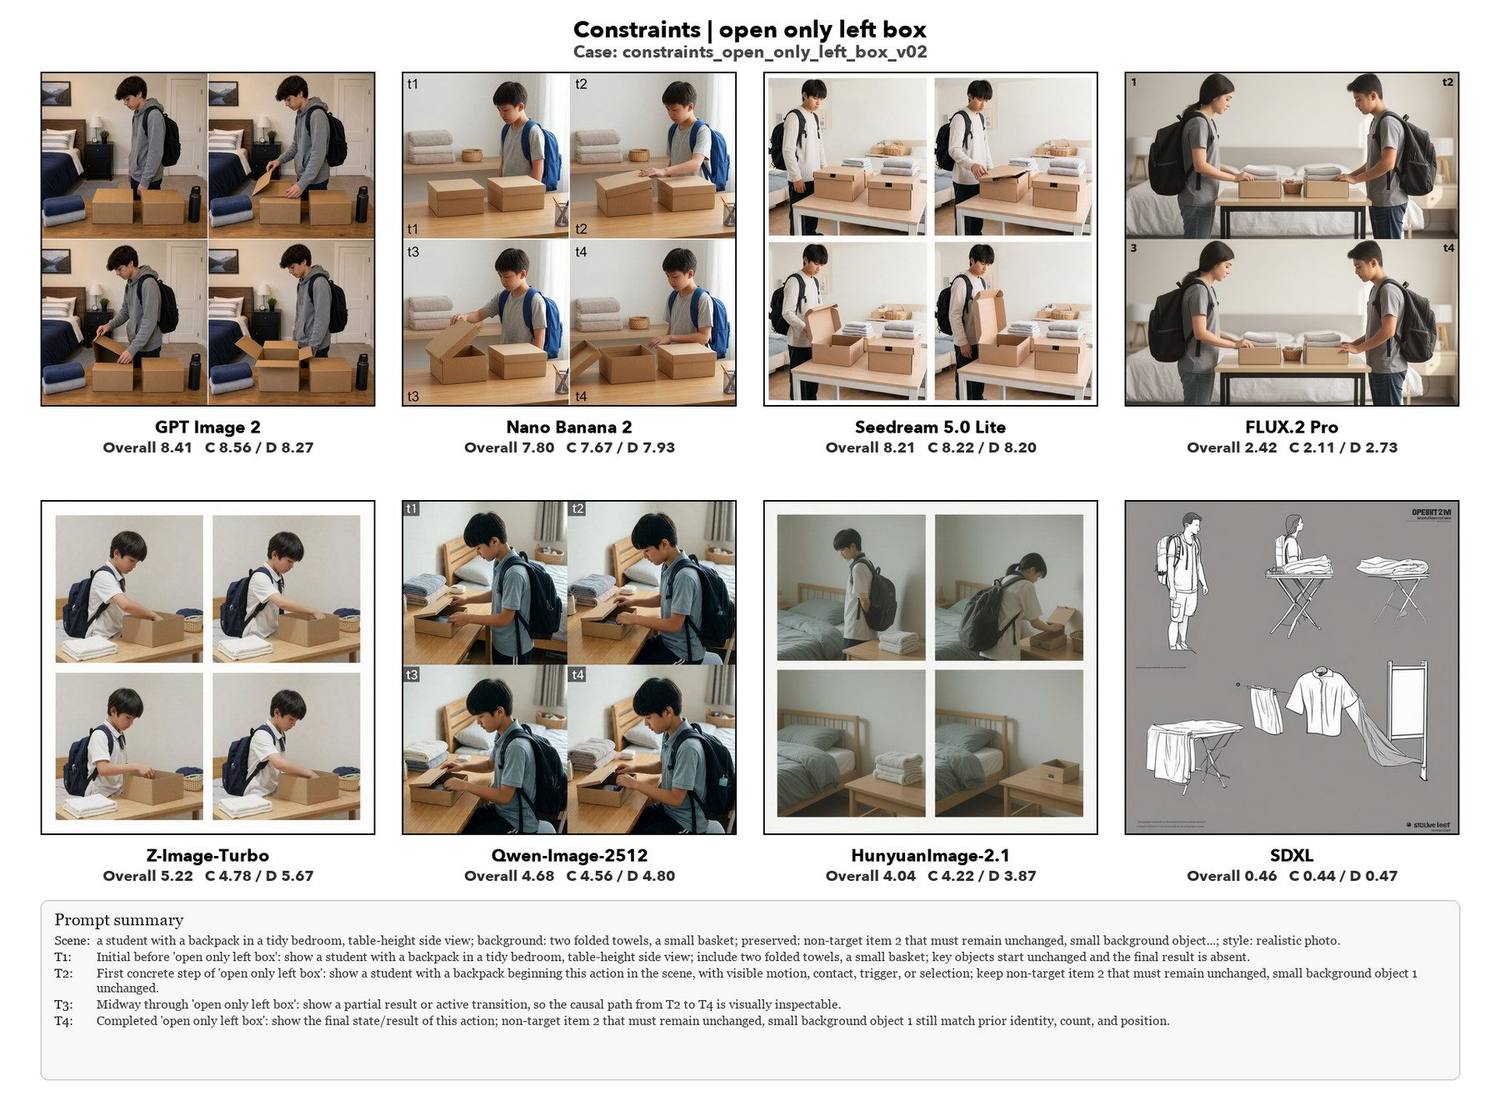
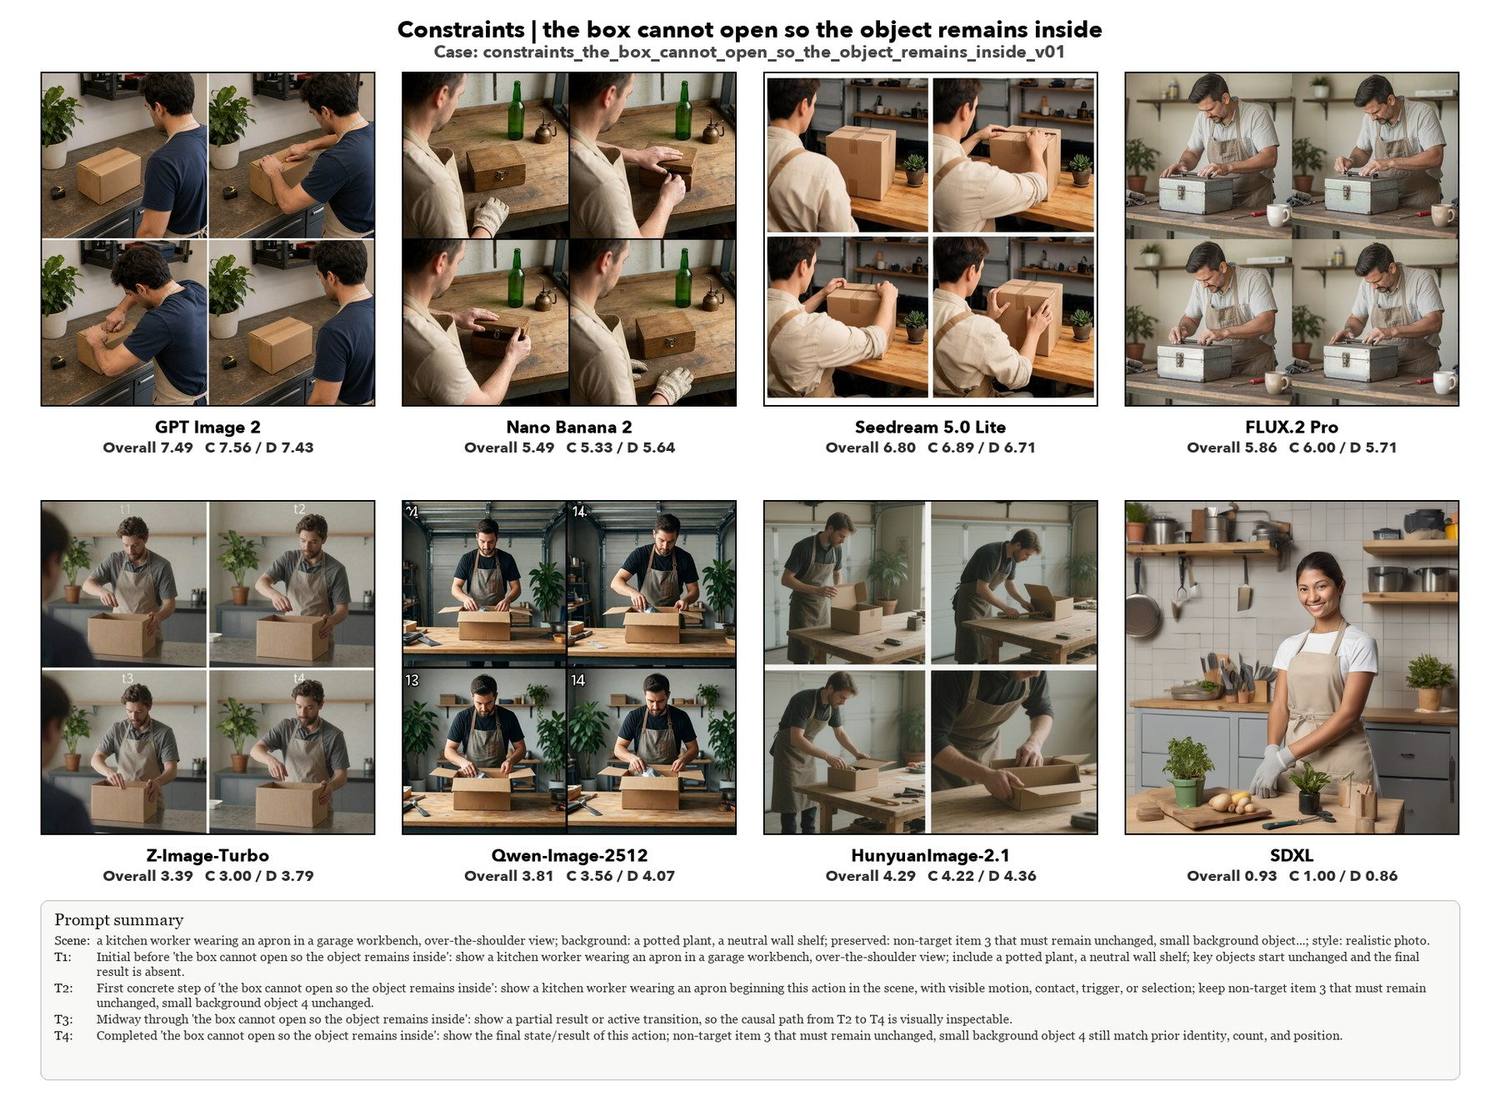
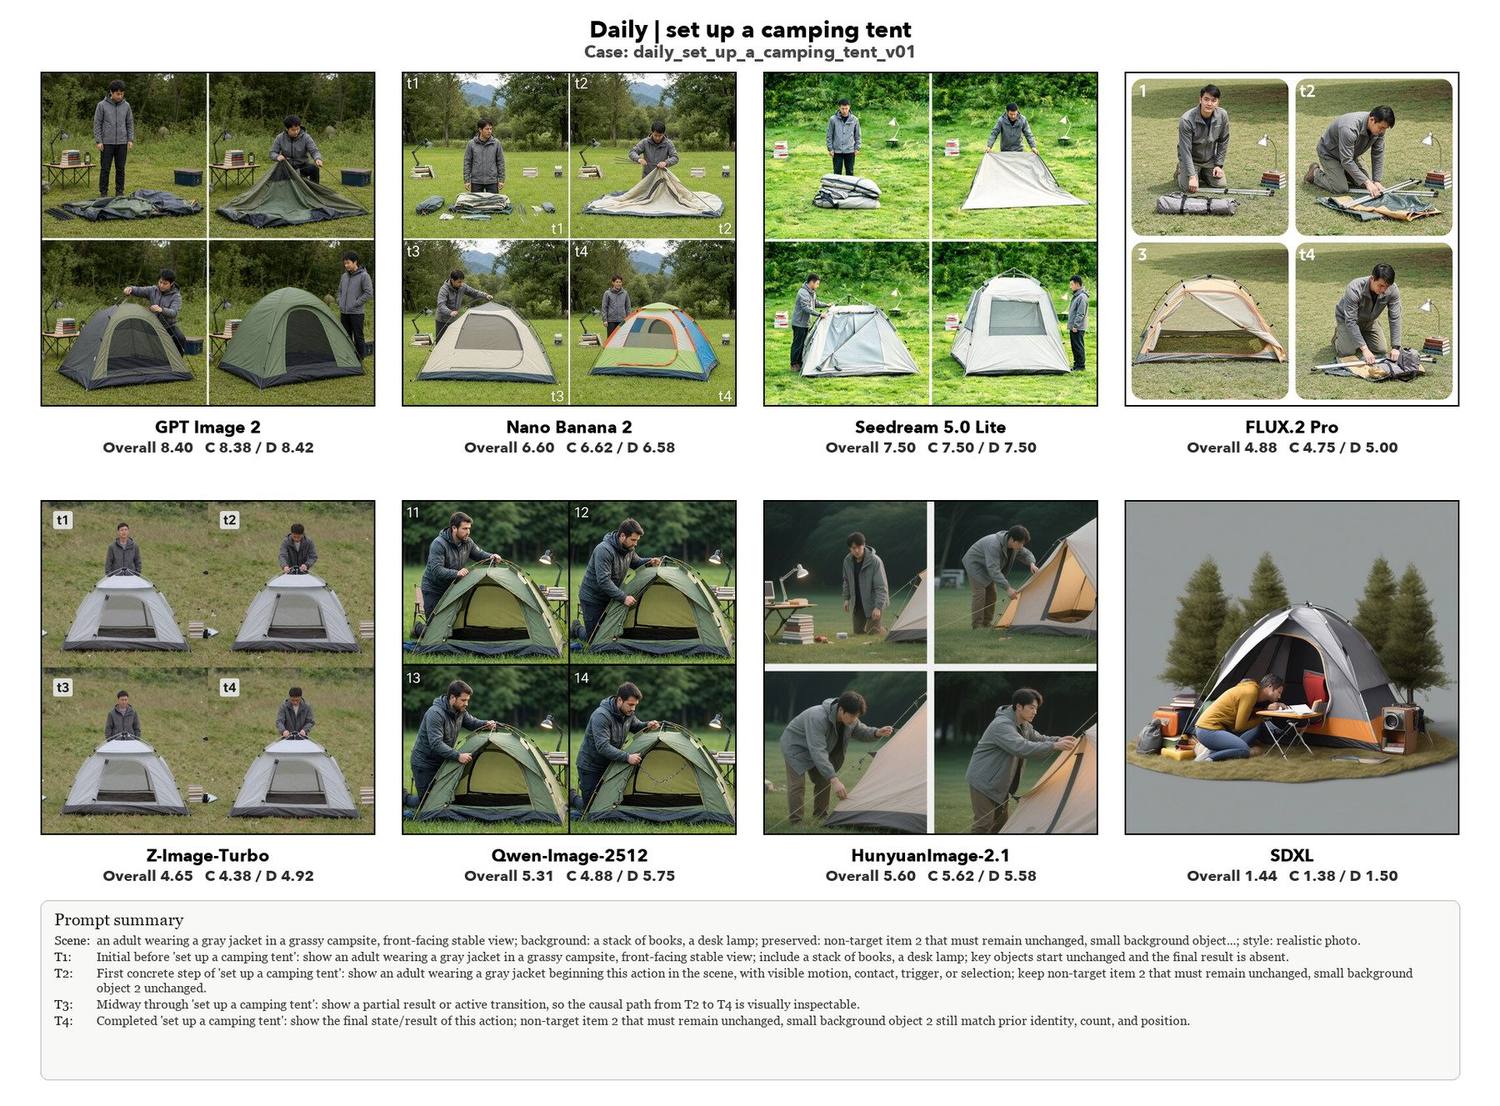
The C0–C9 capability profile. The top systems span a wide, even polygon; weaker models cave in on motion, temporal and causal axes while keeping layout and quality.
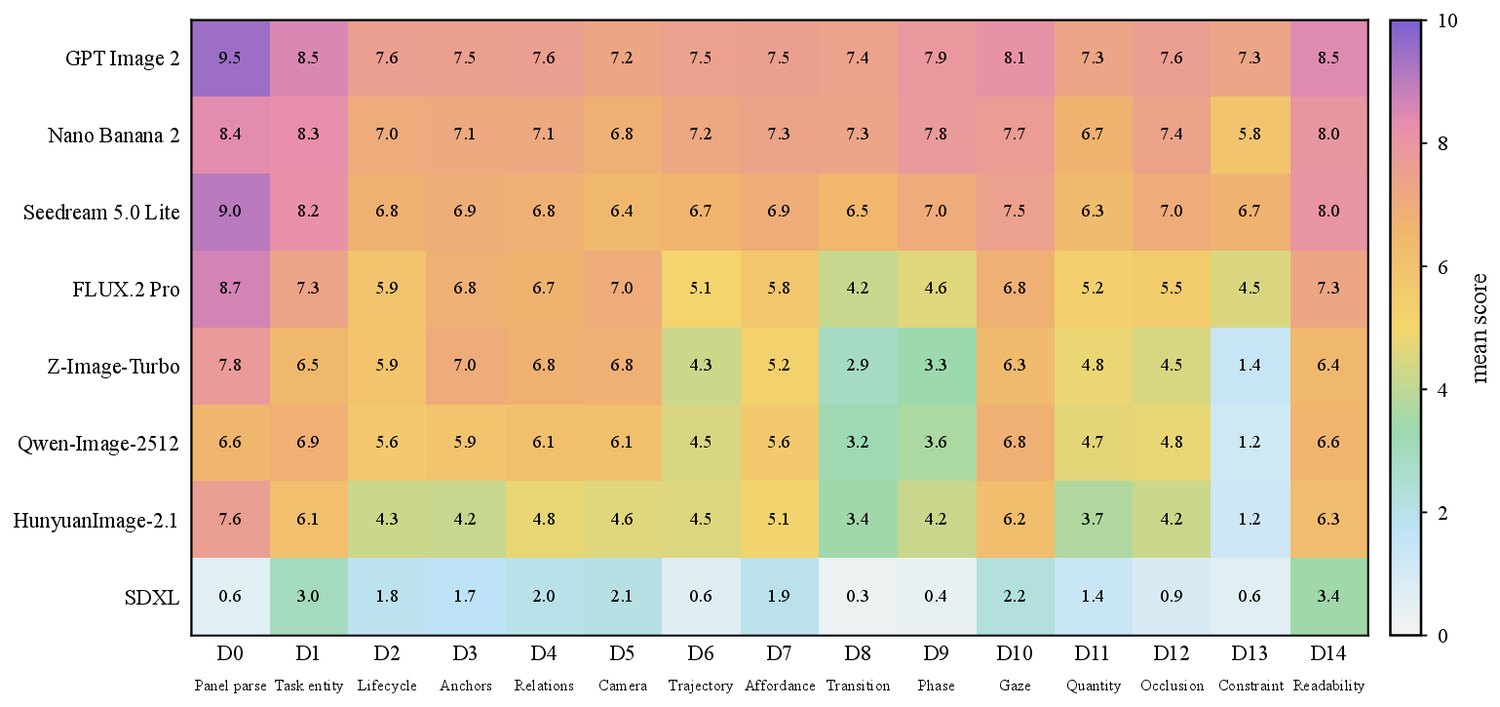
Per-diagnostic mean scores across all eight models. Everyone parses the 2×2 panel (D0) and renders legibly (D14); the real bleeding is on state transition (D8), phase ordering (D9) and constraint adherence (D13).
Beyond the four-frame interface
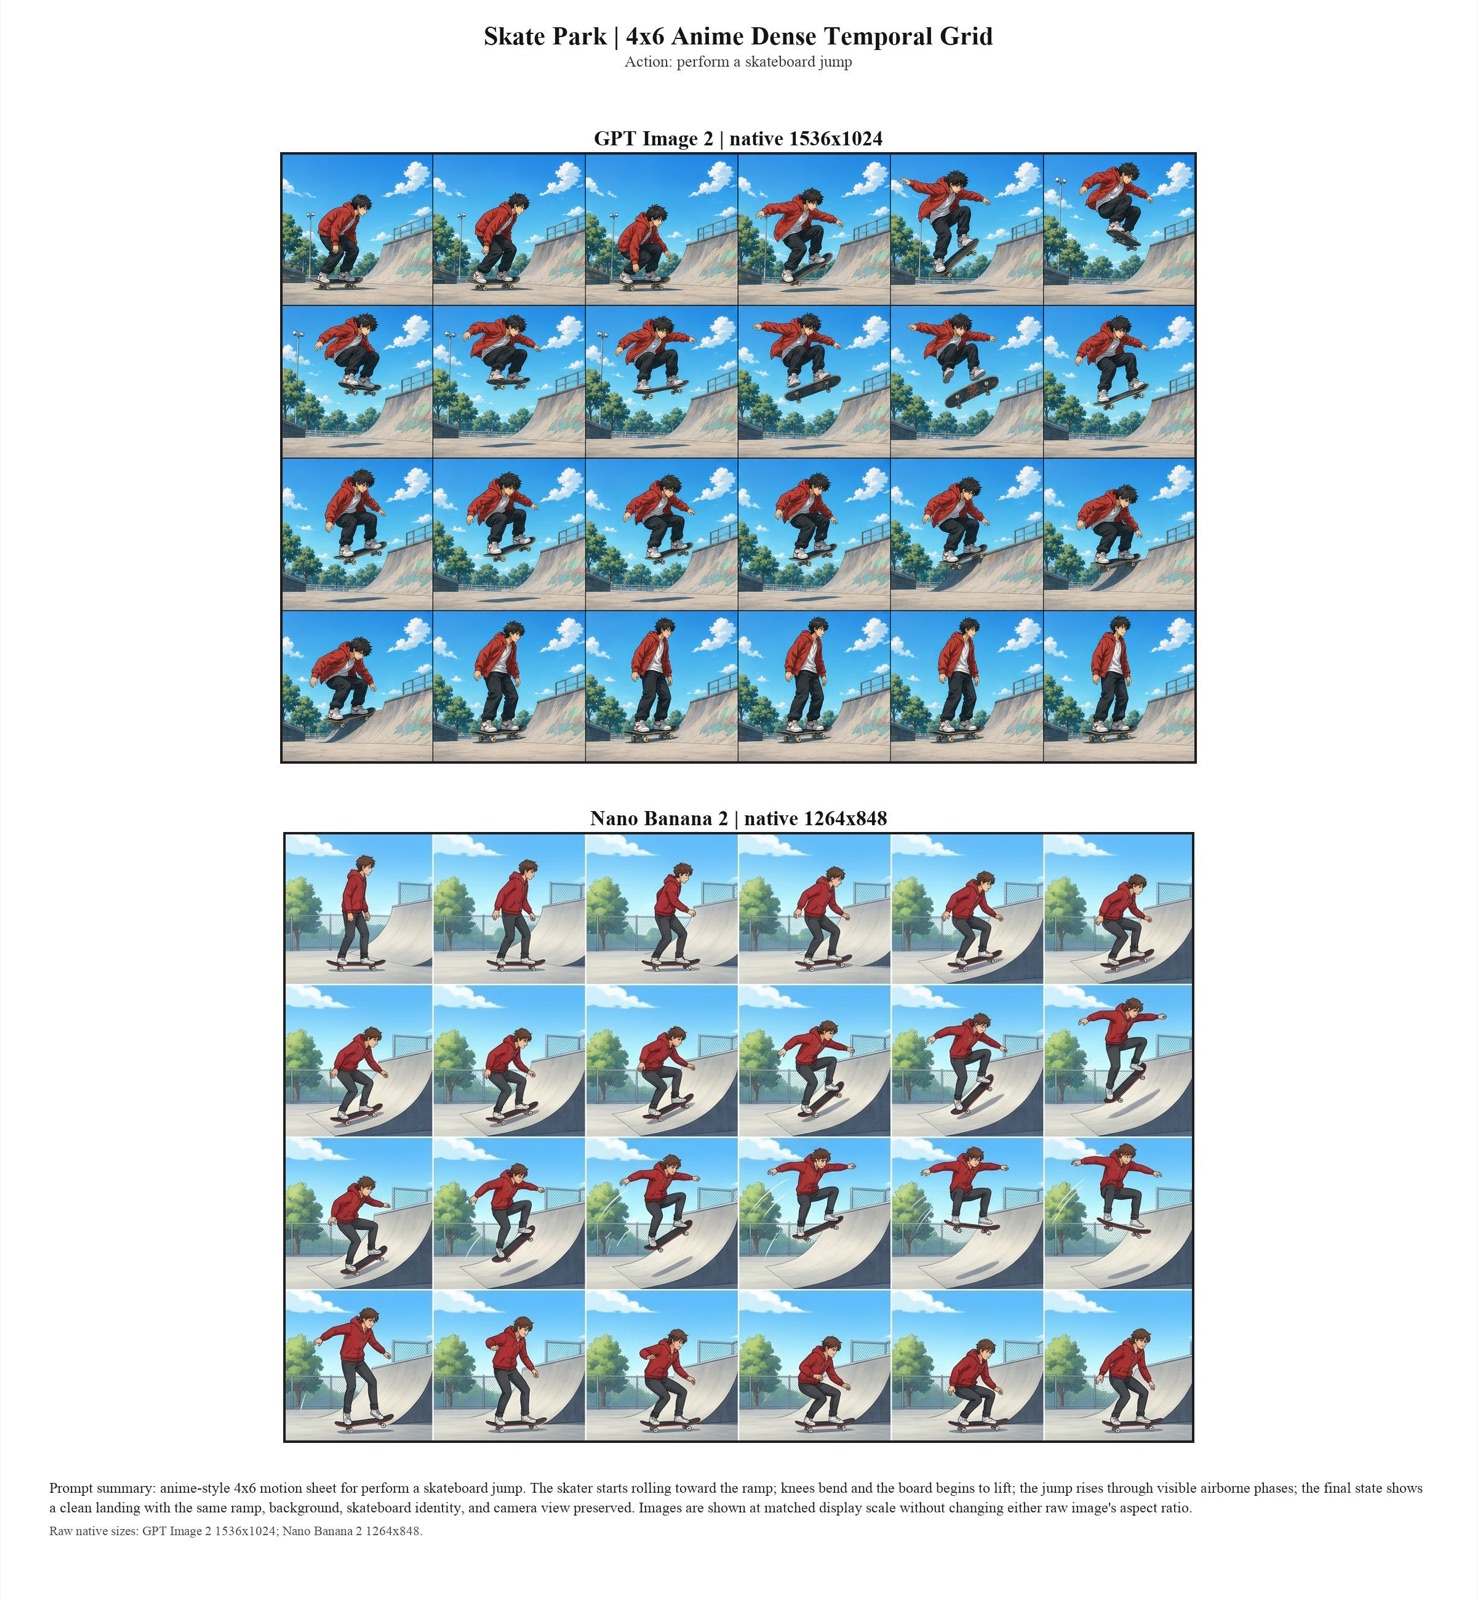
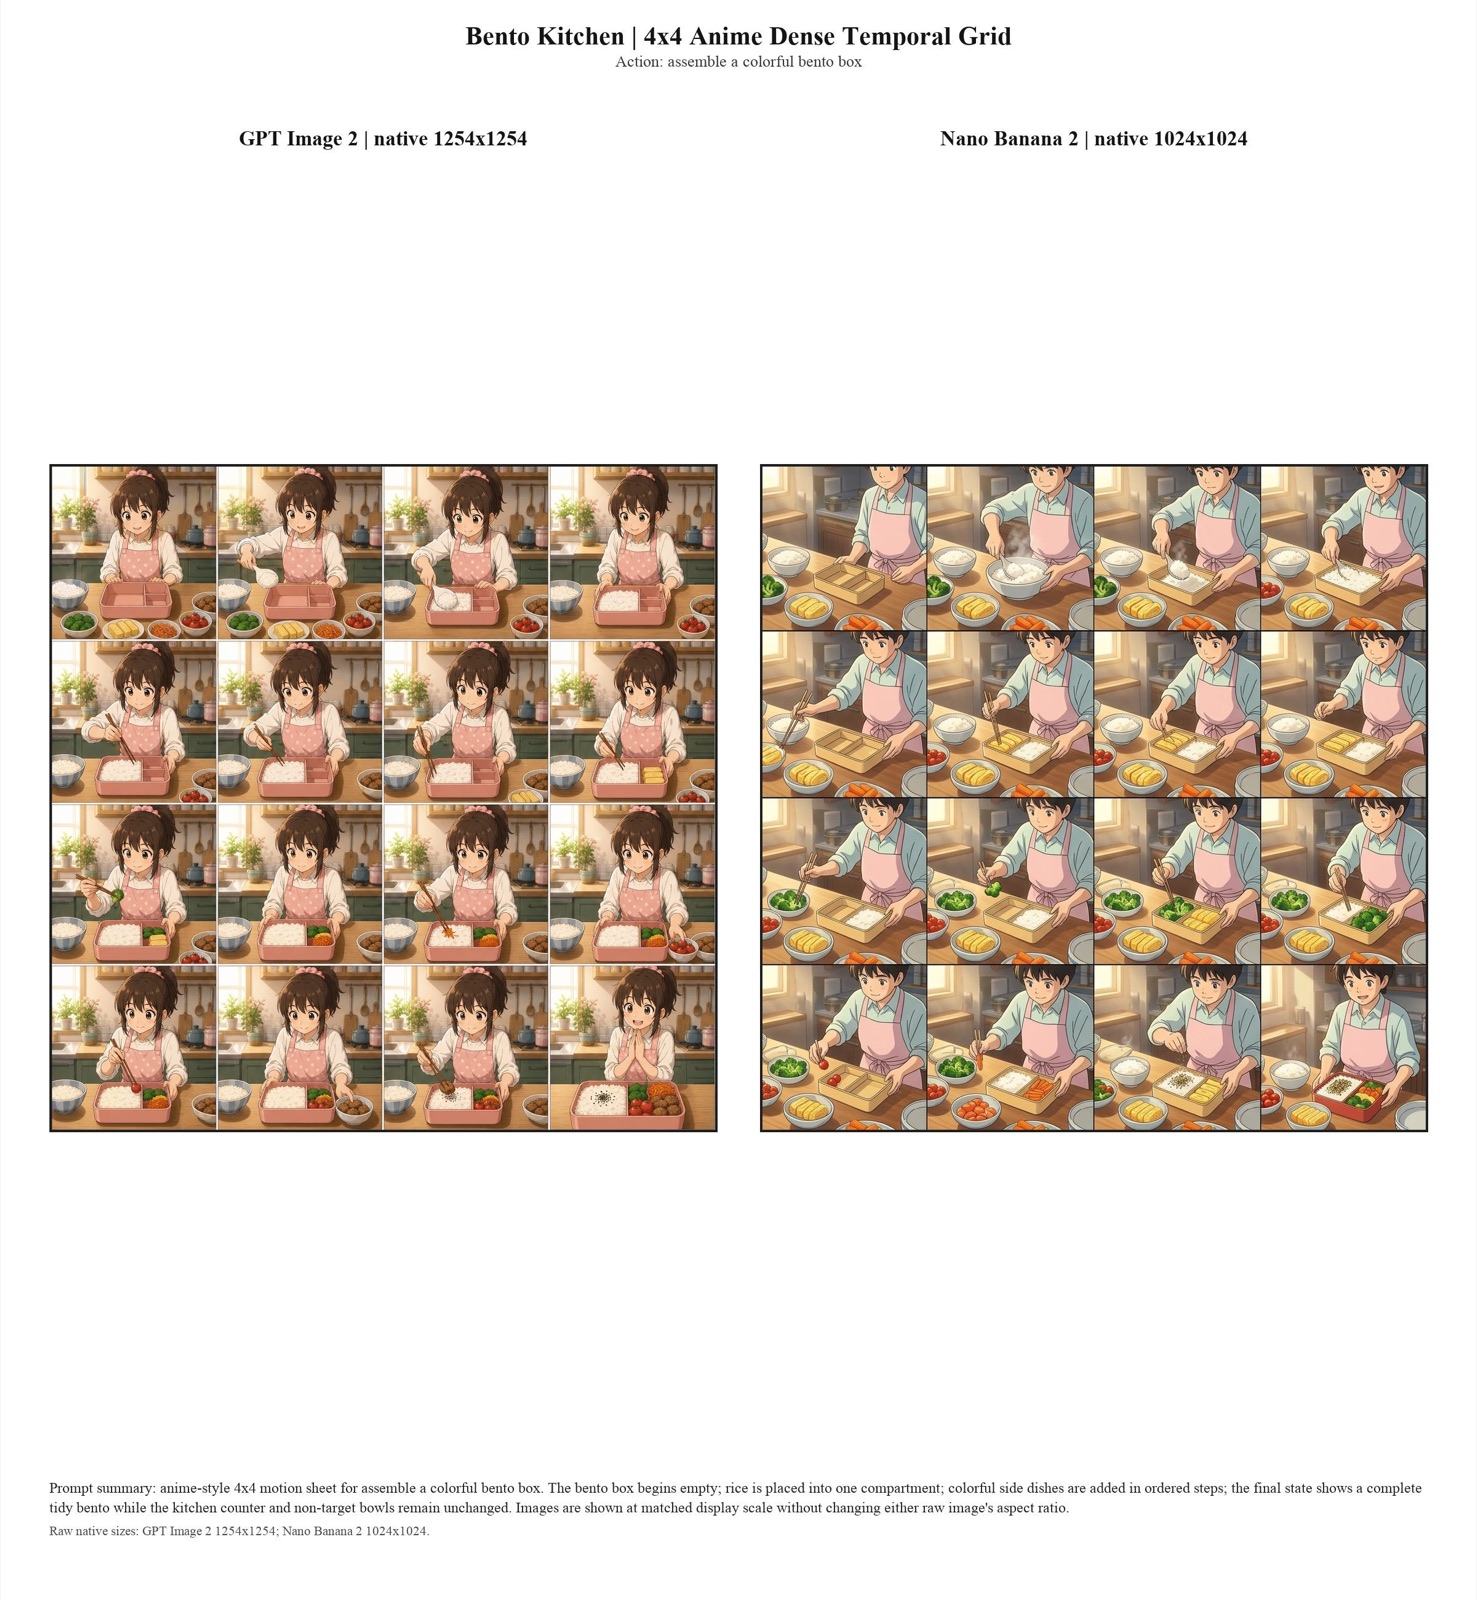
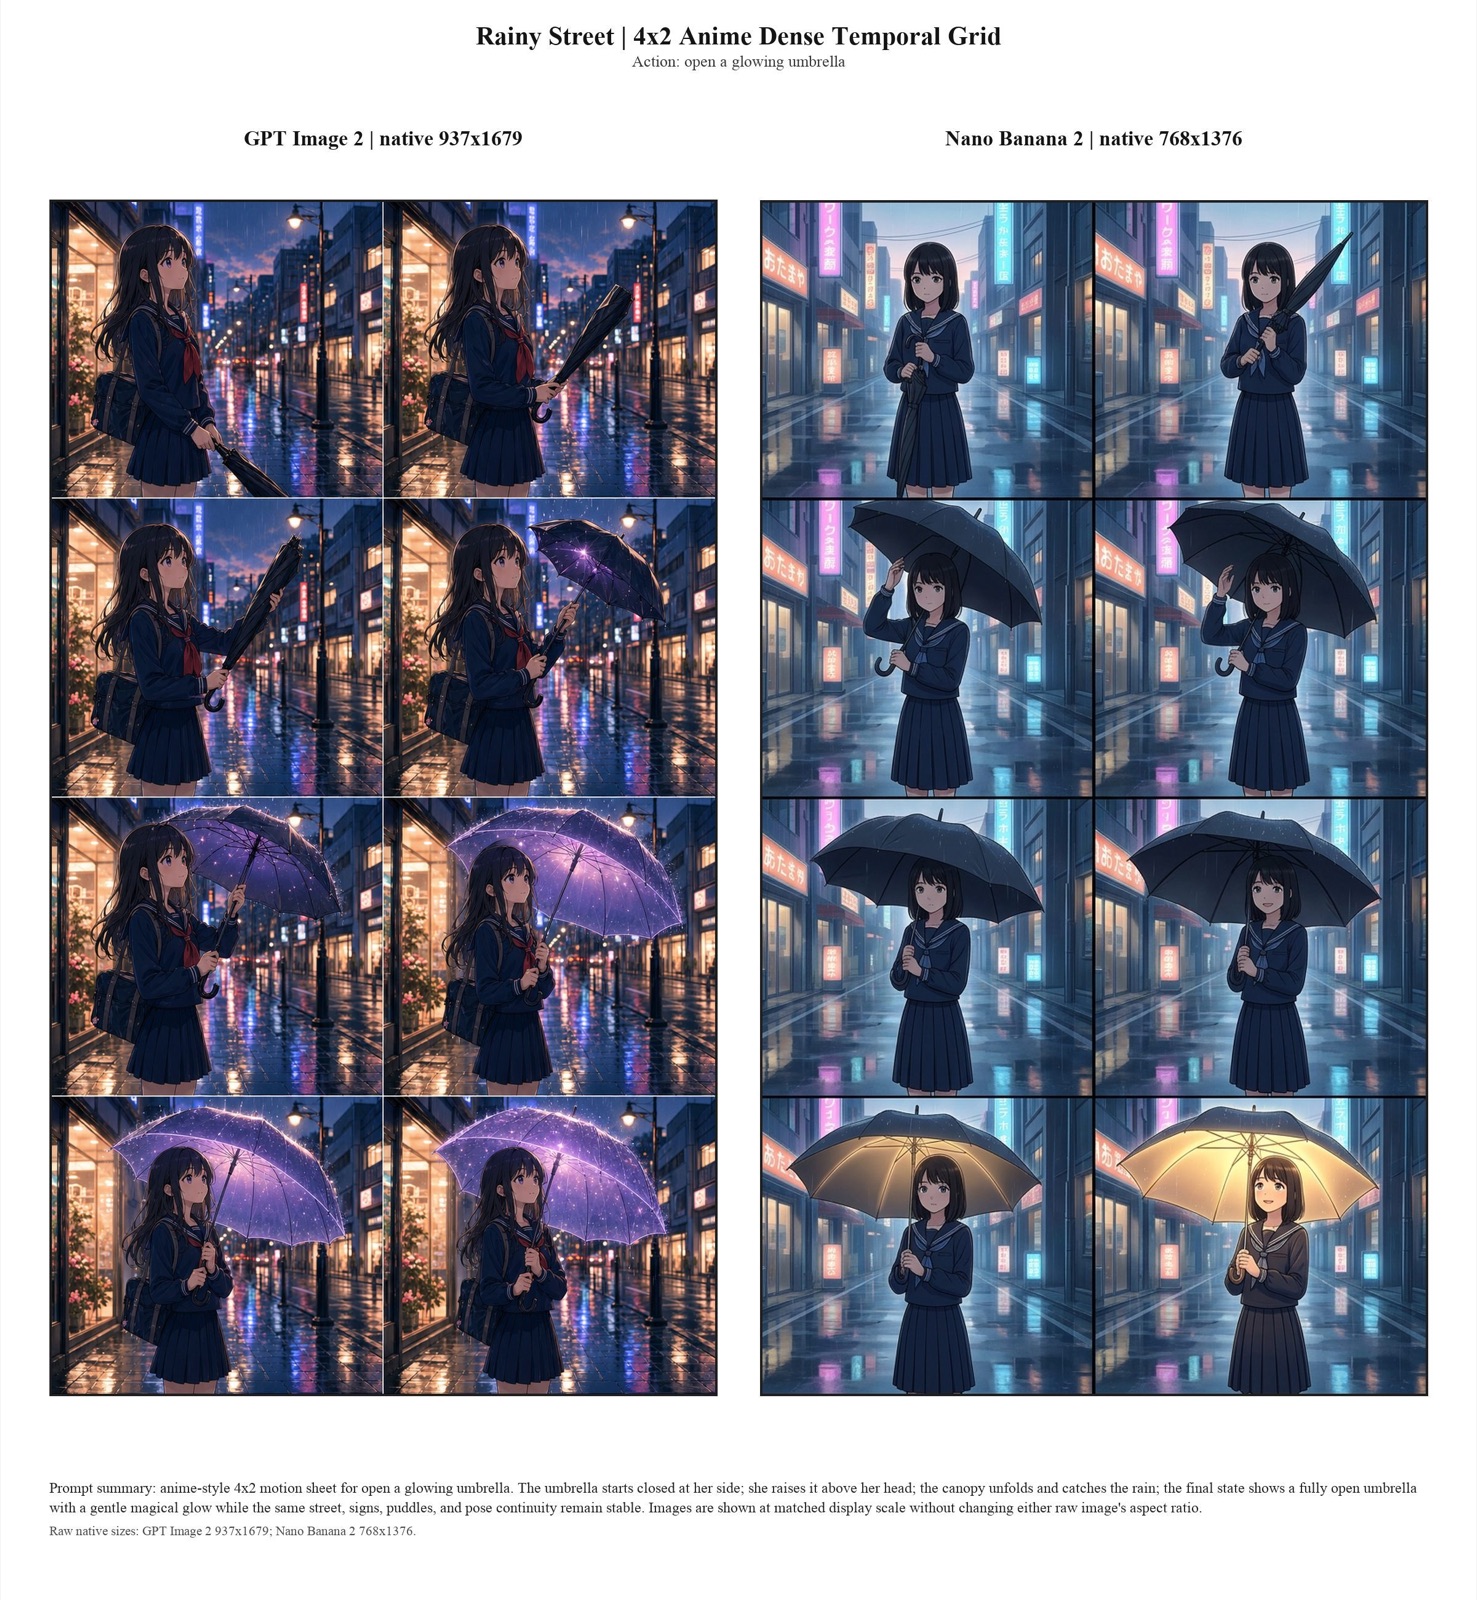
A bonus probe pushes the strongest models past 4 frames into dense 4×2 – 4×8 temporal grids — a whole continuous process rendered in a single static image.

Side by side
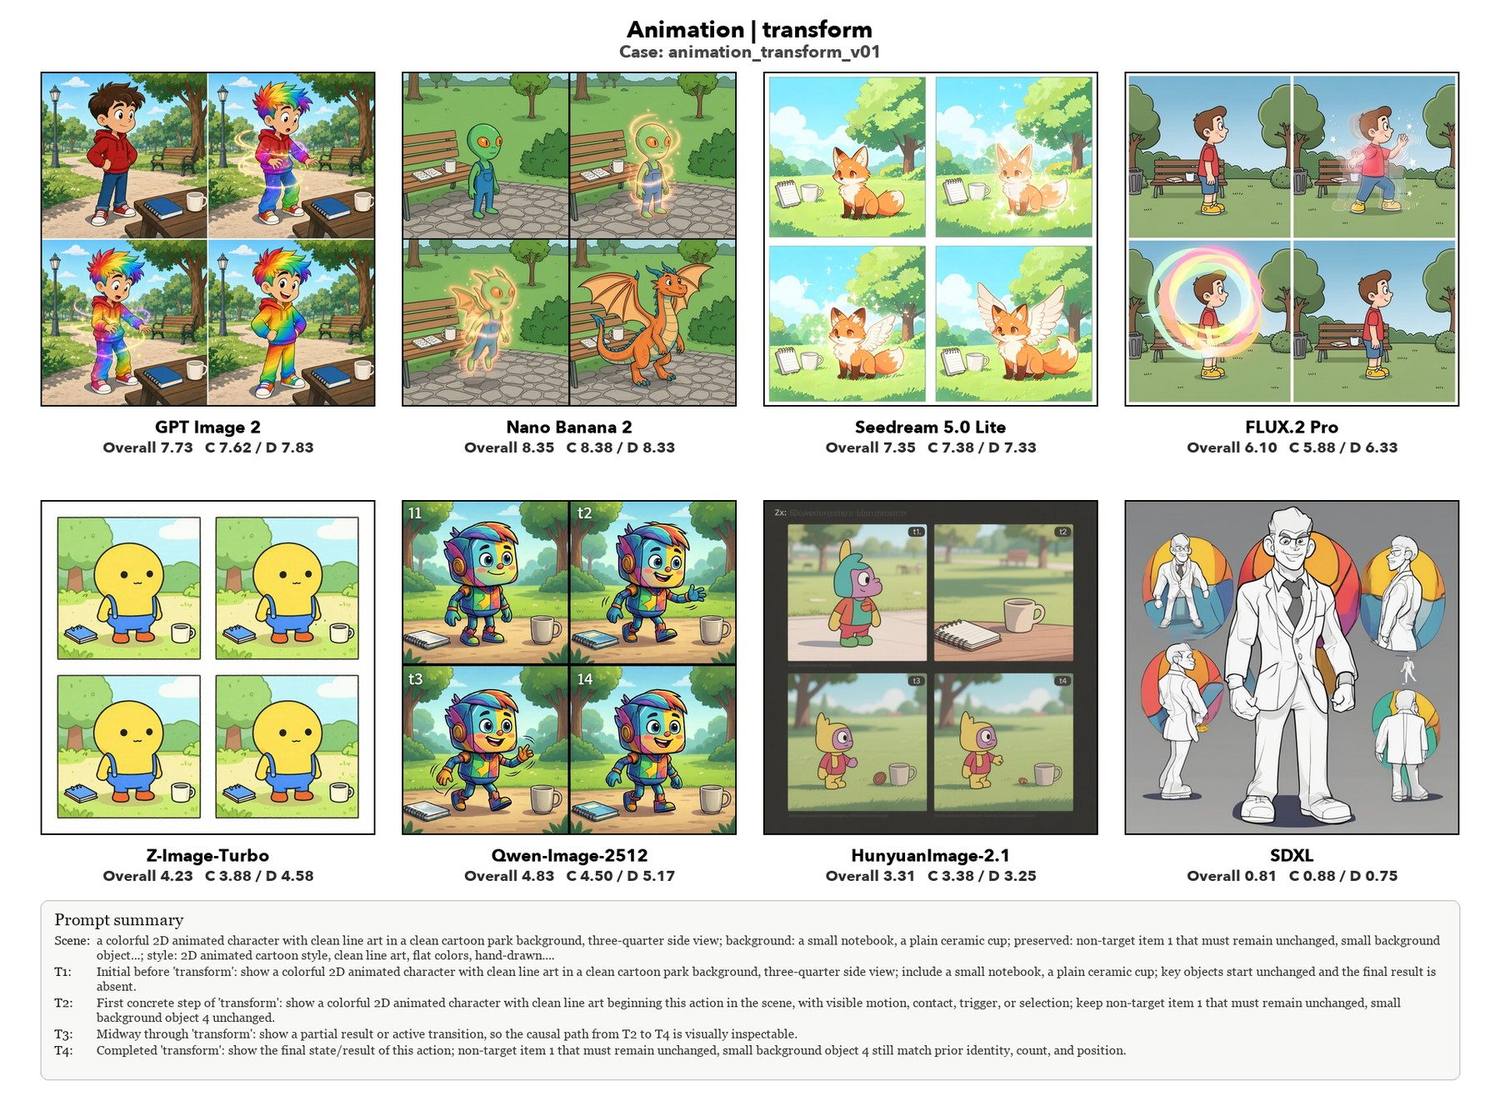
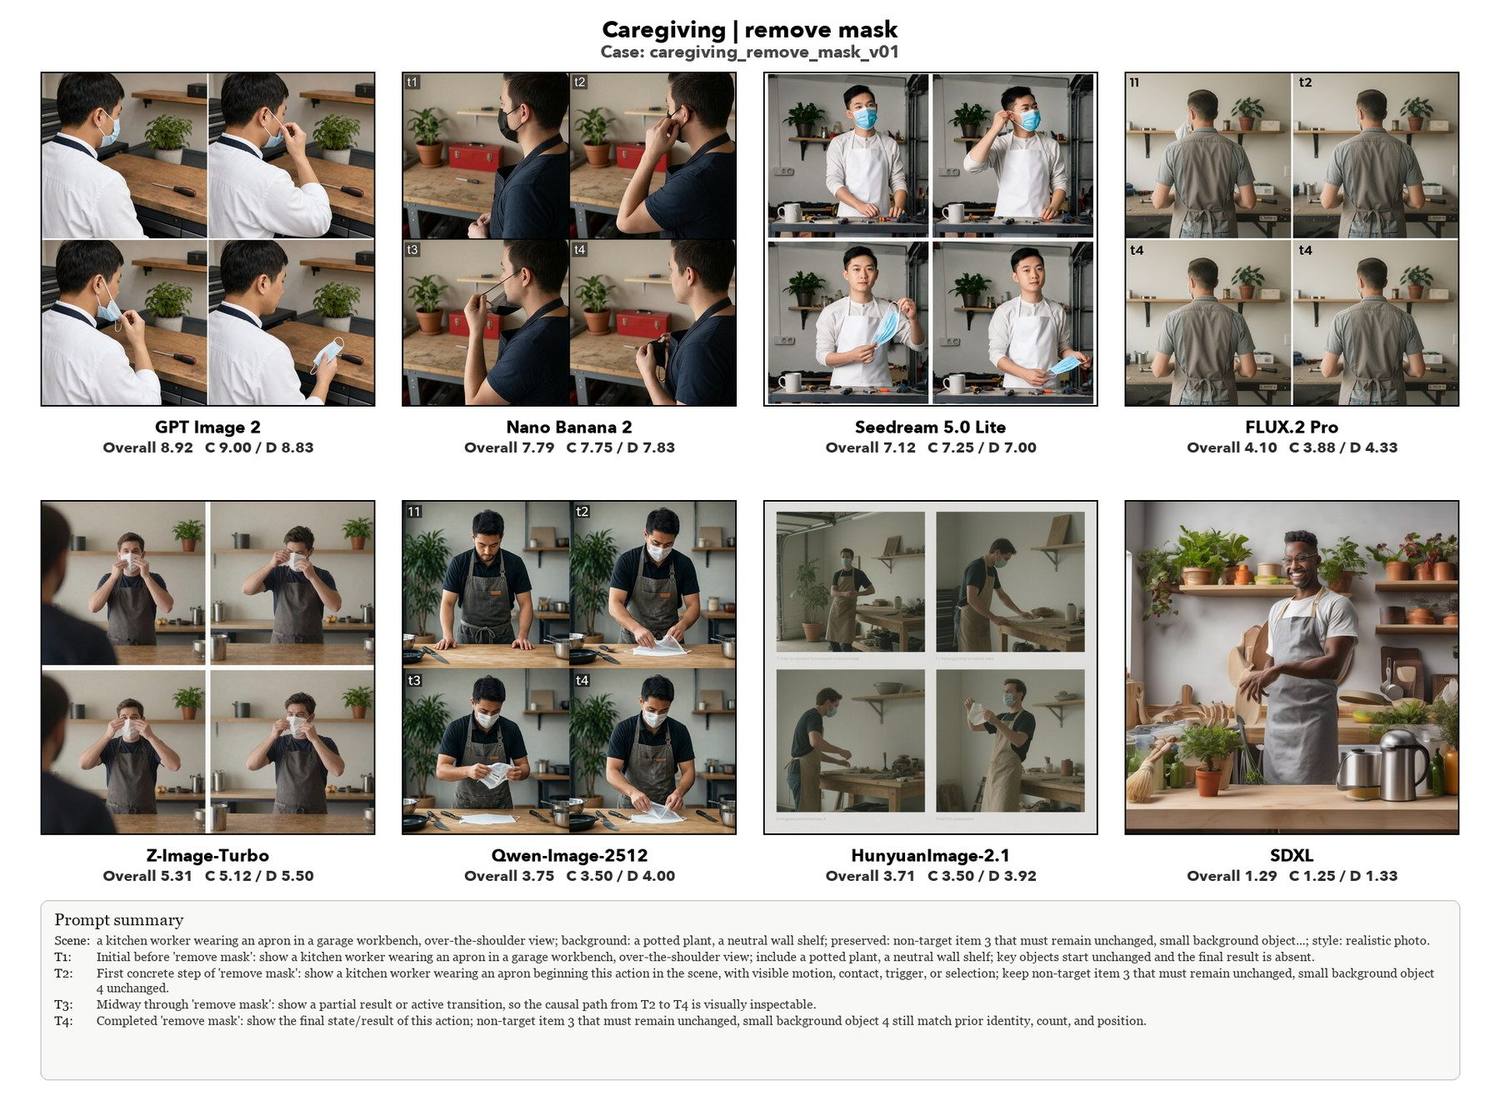
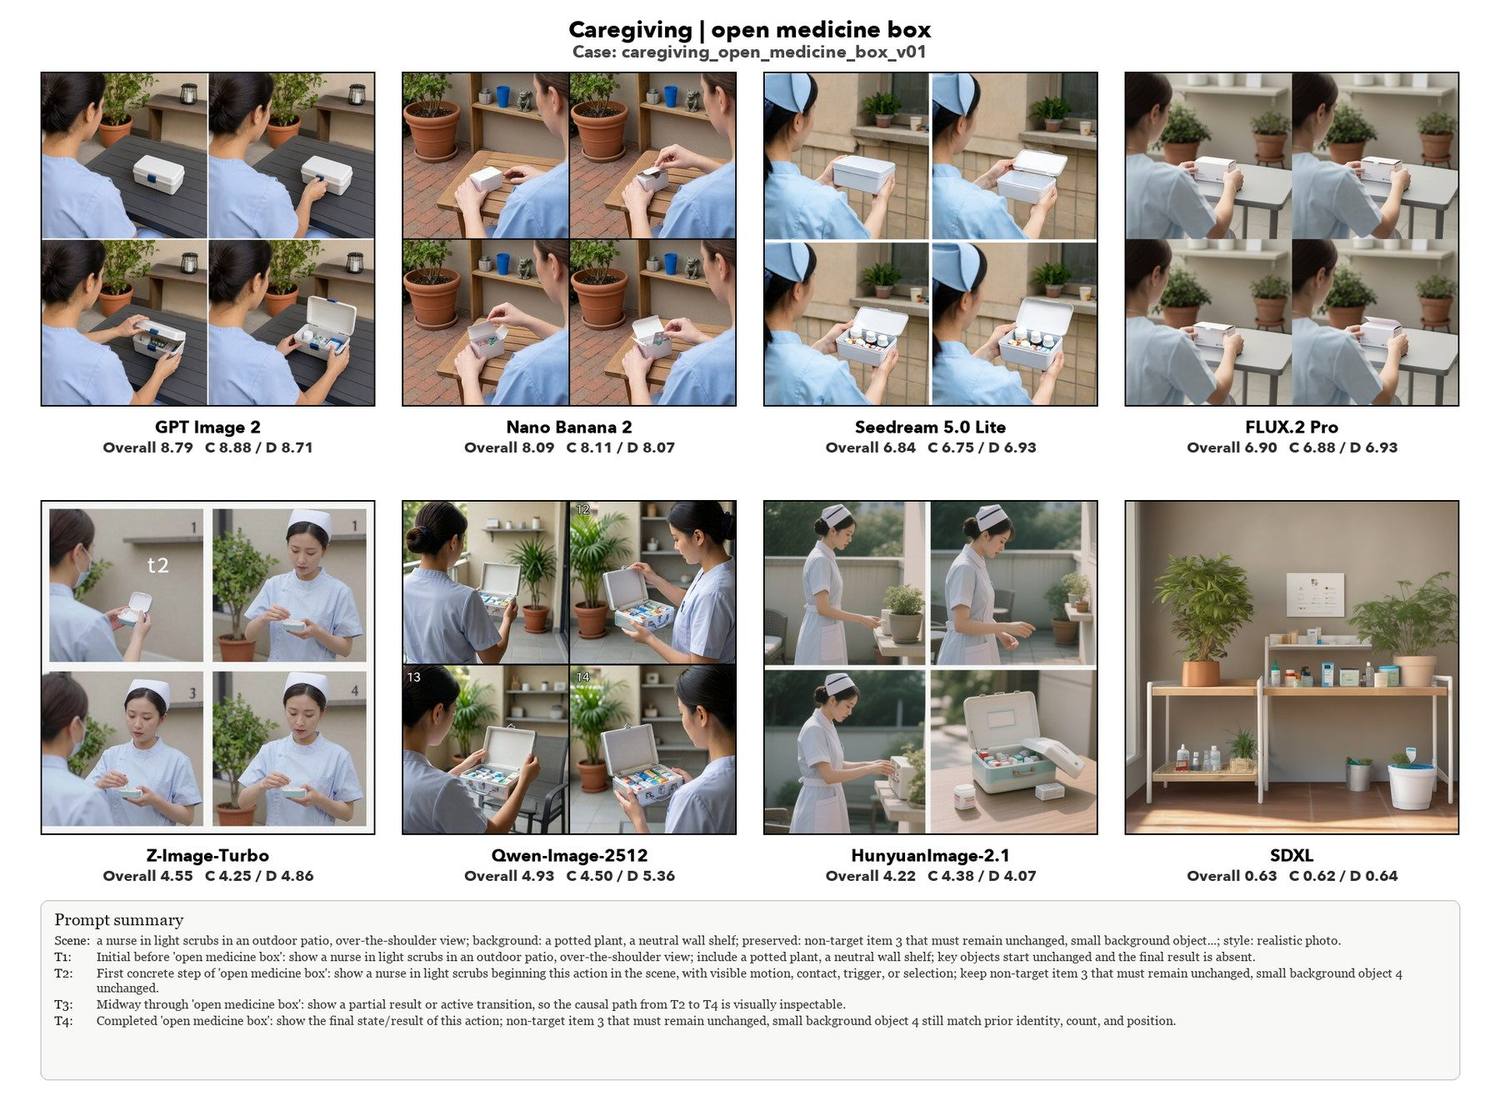
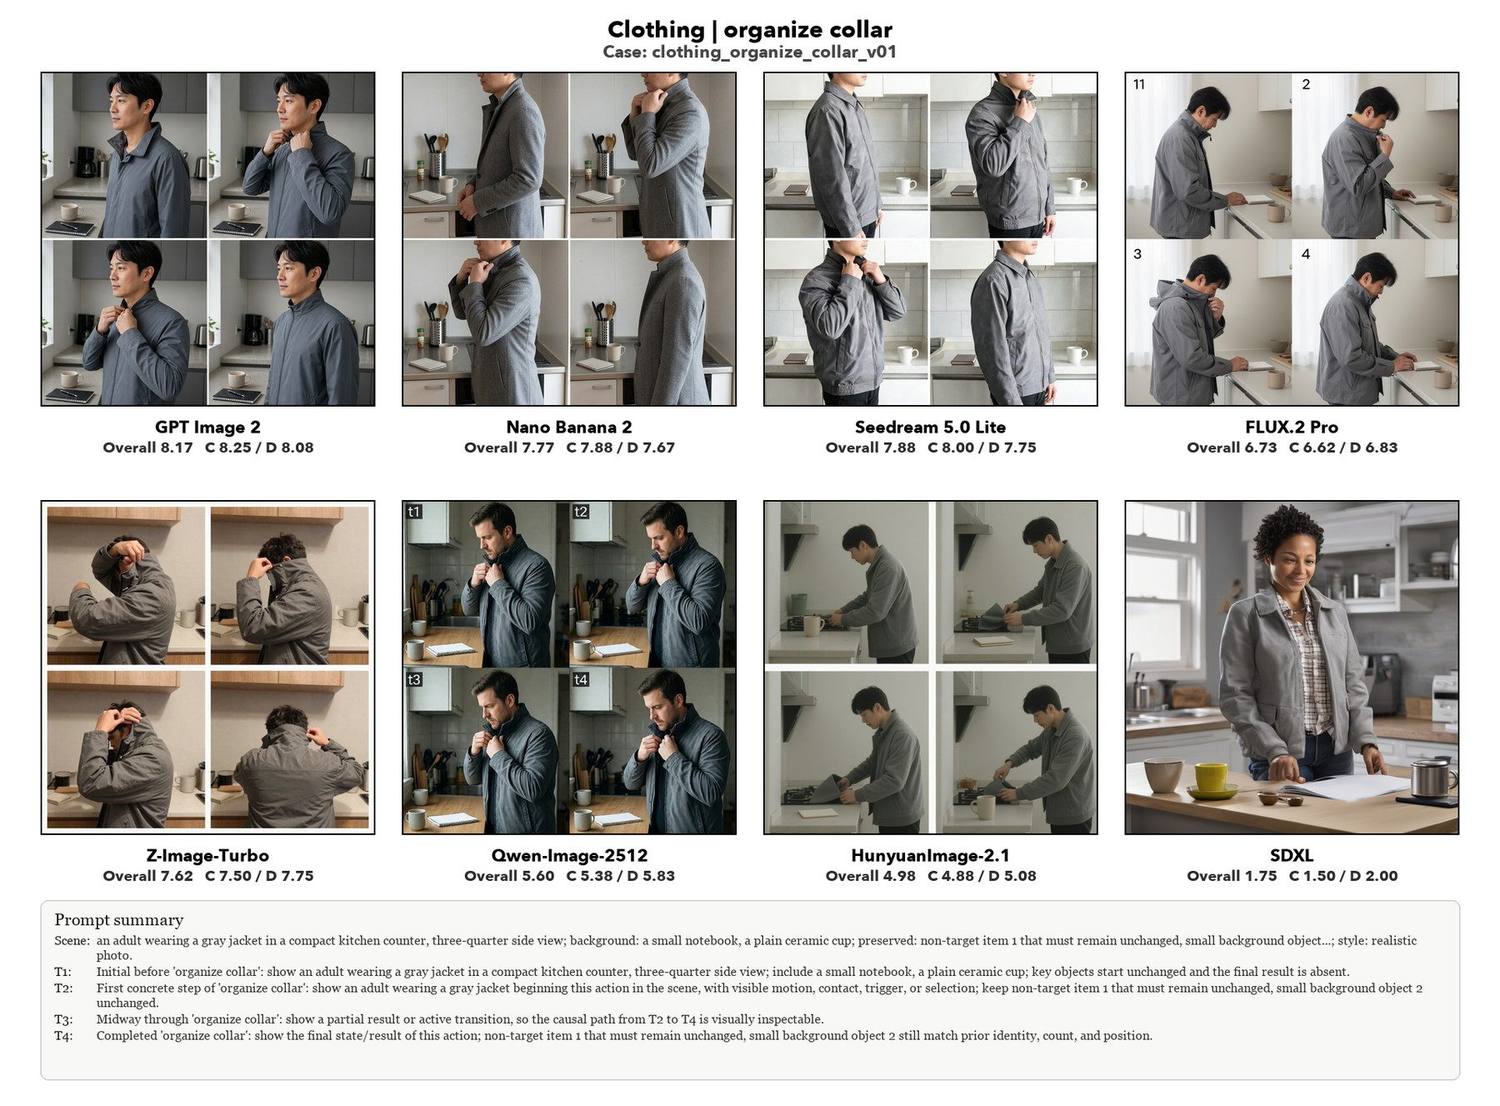
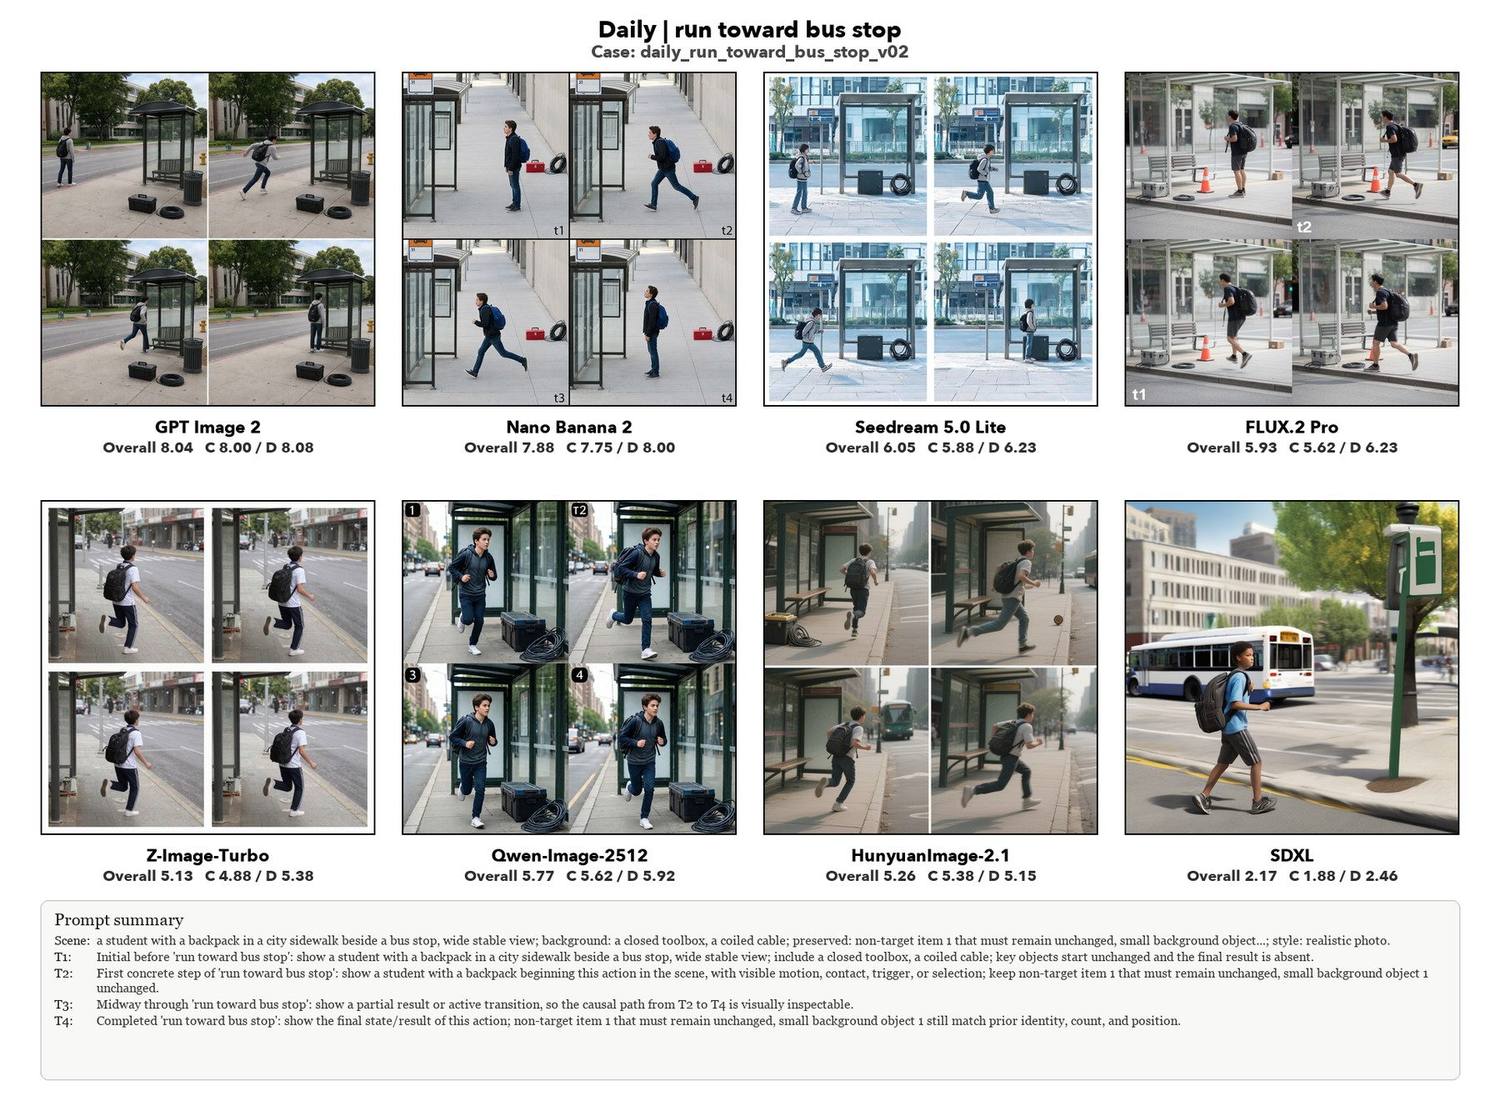
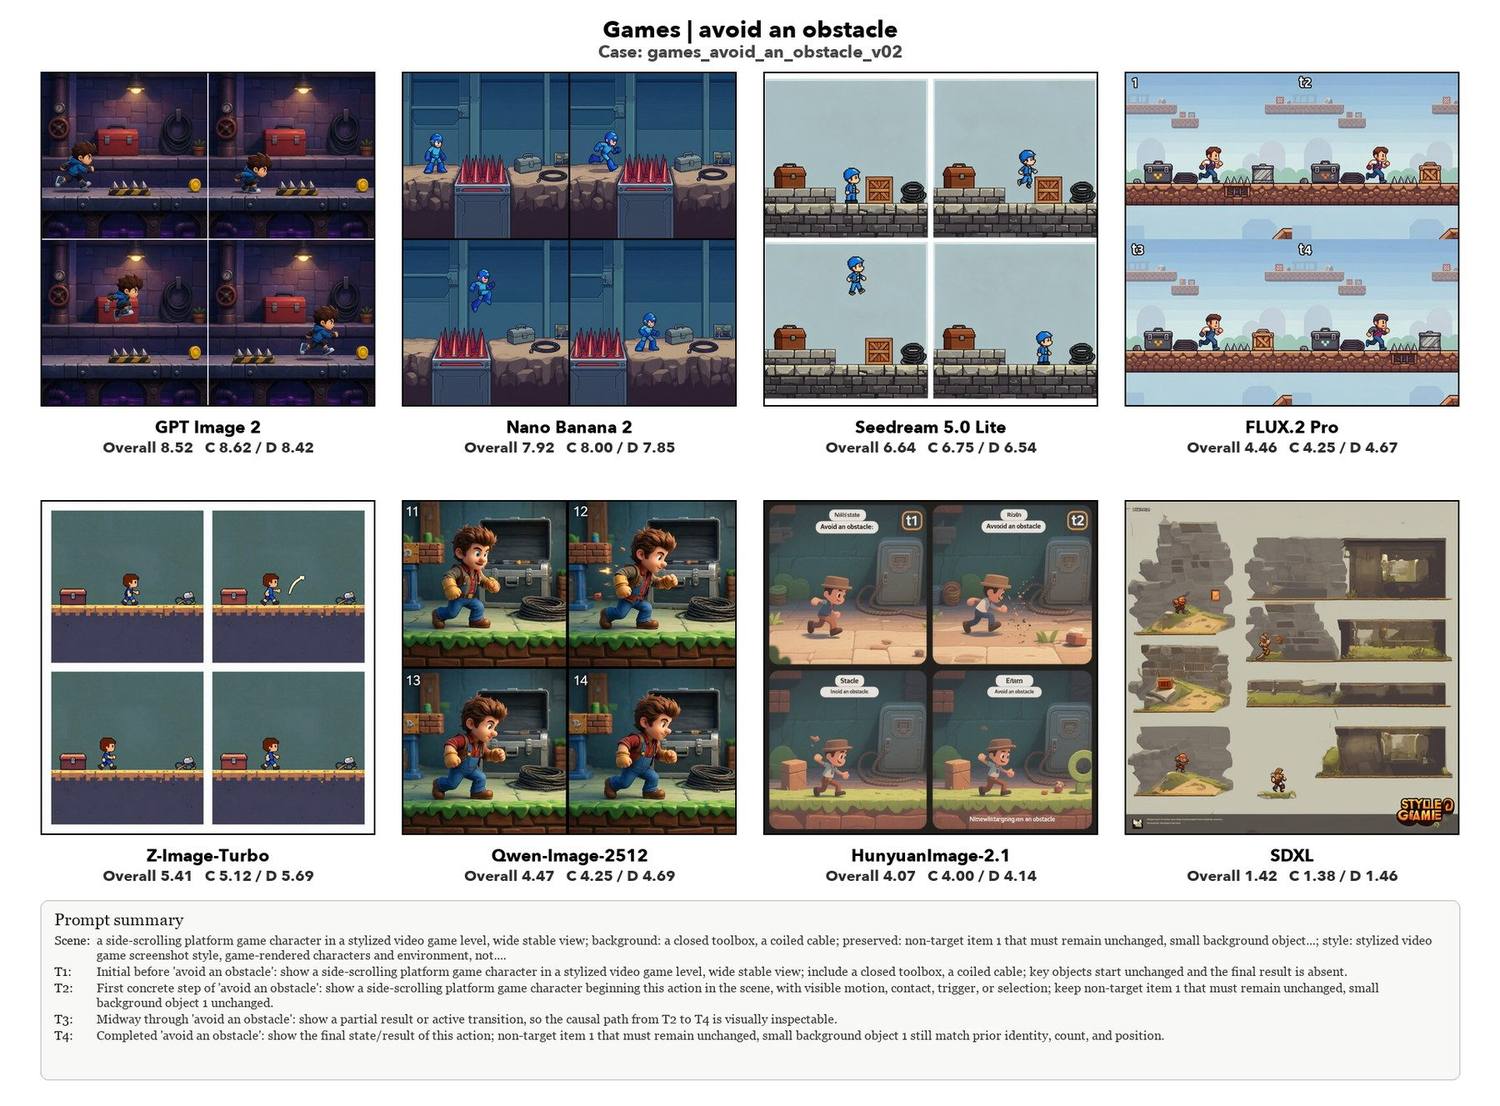
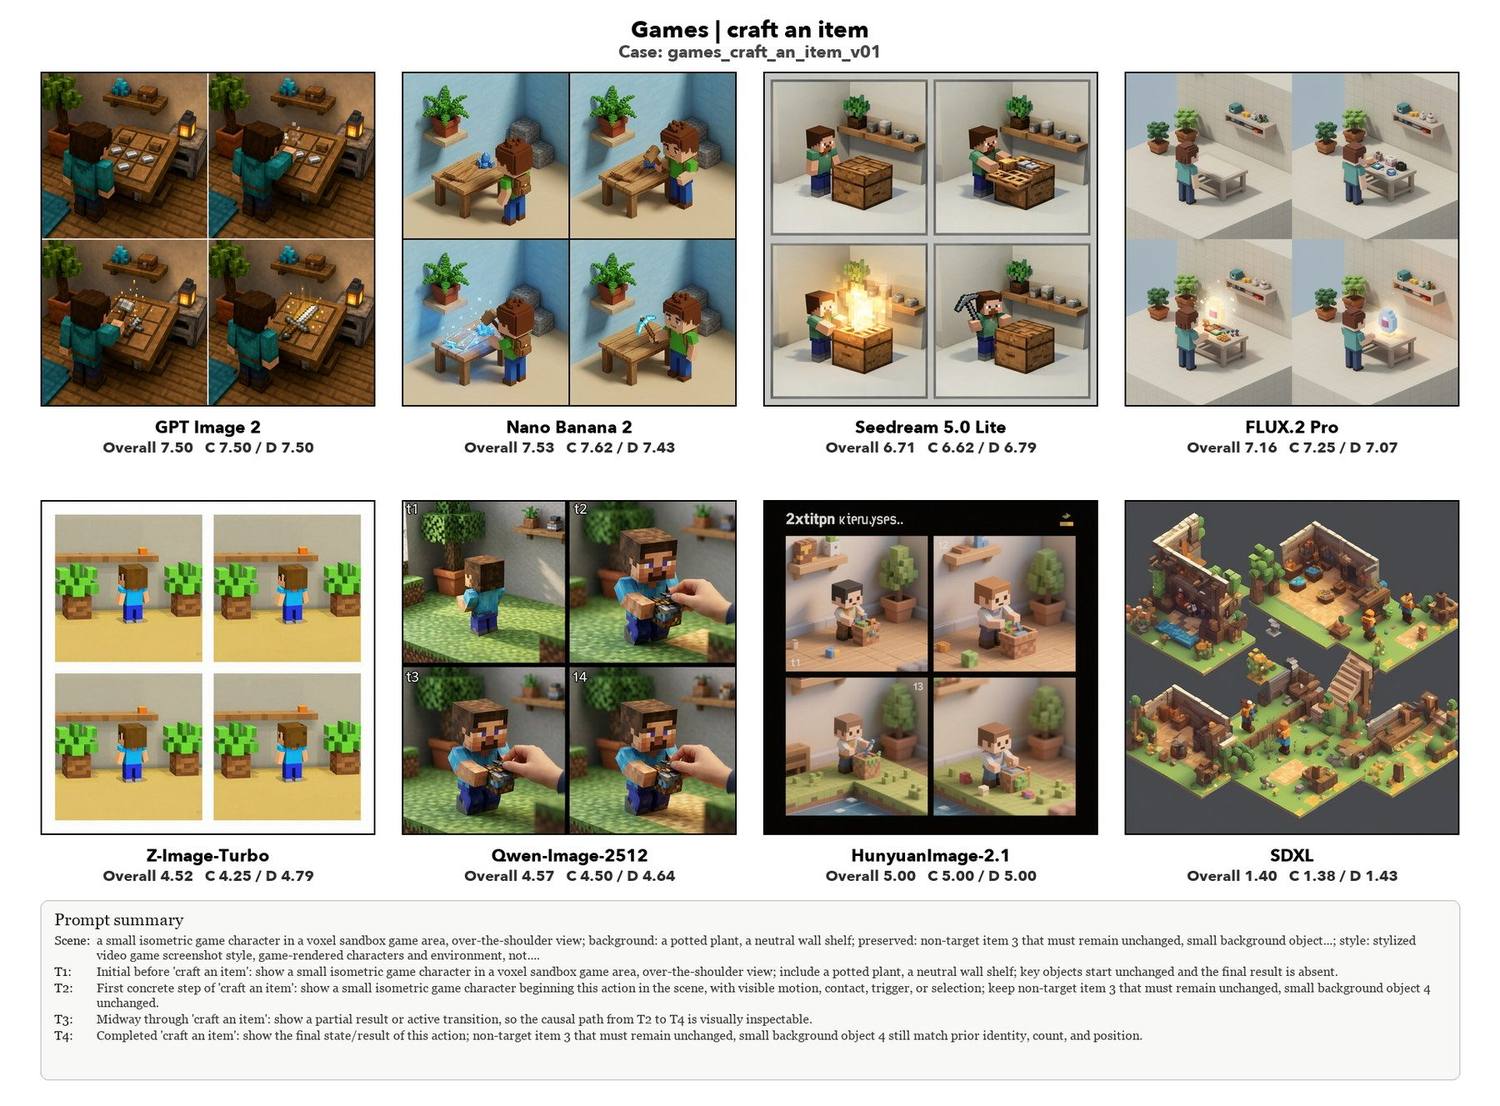
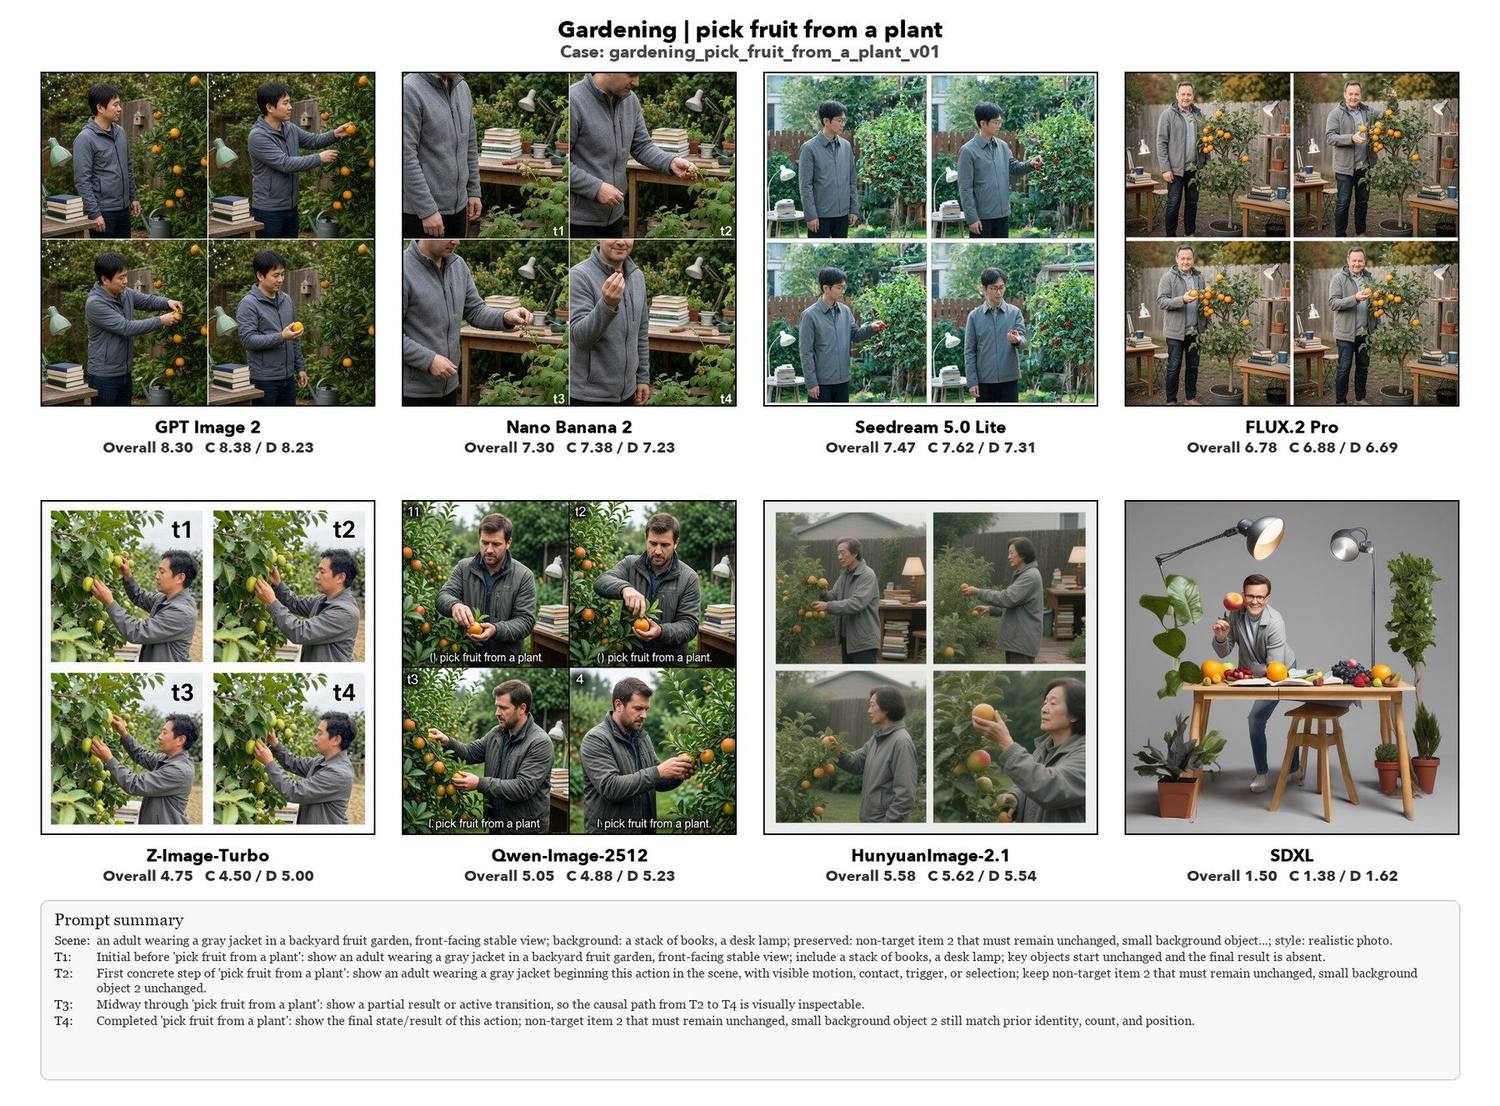
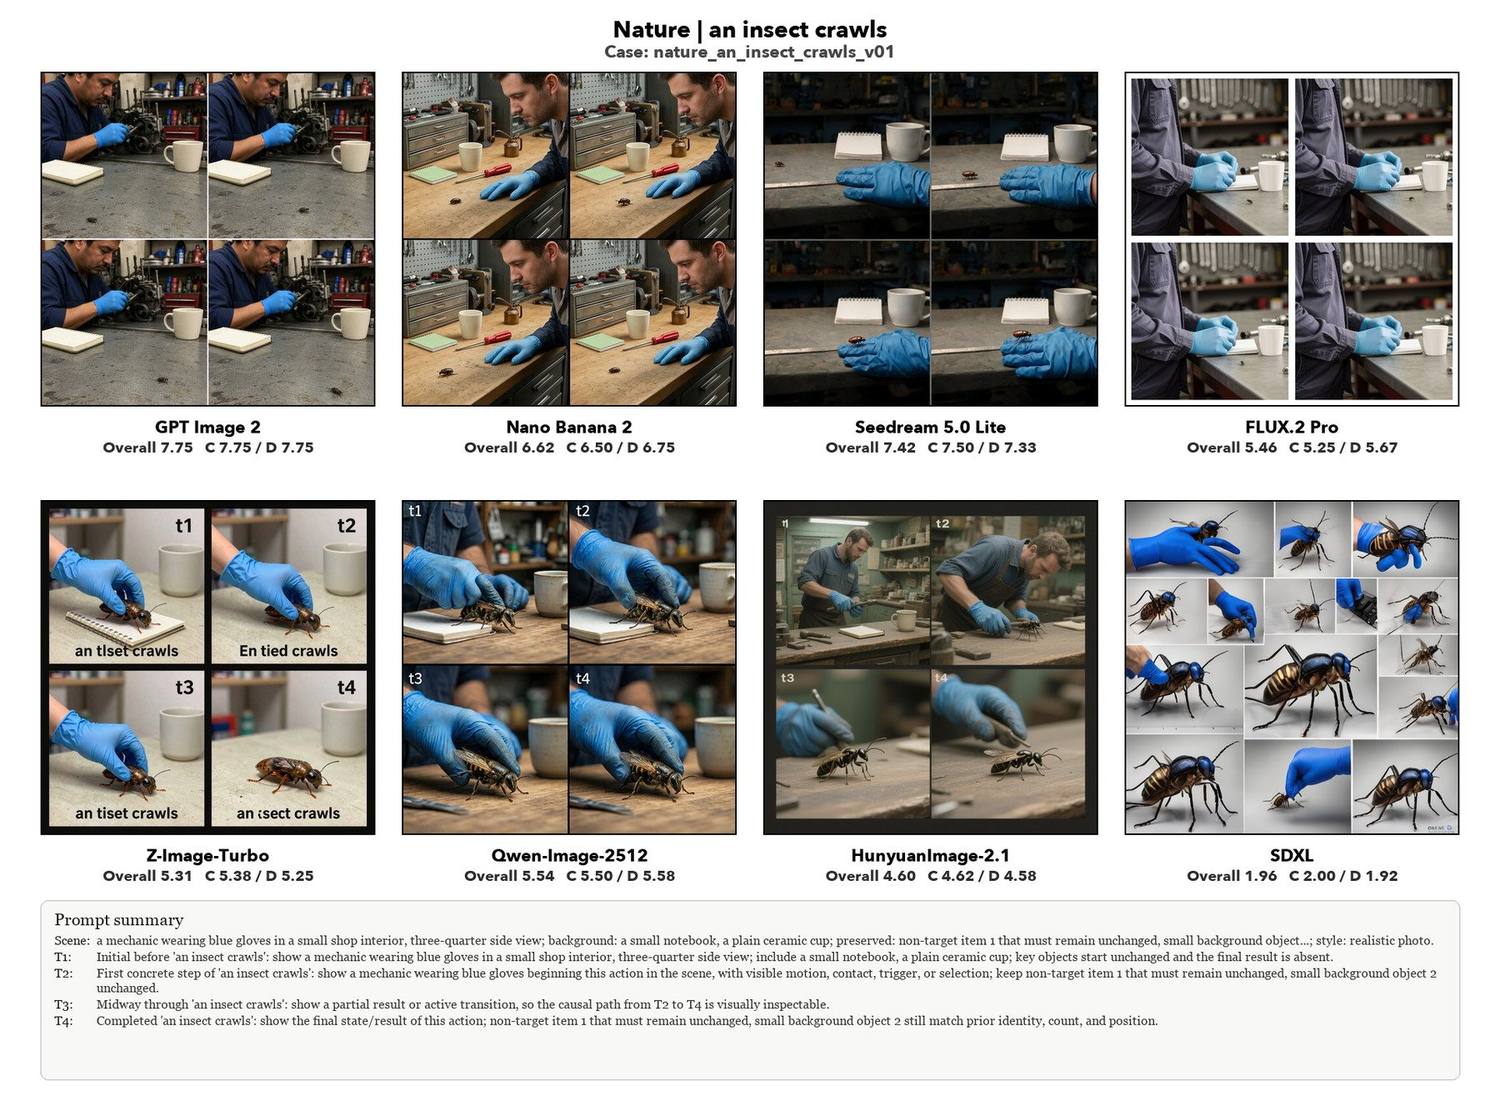
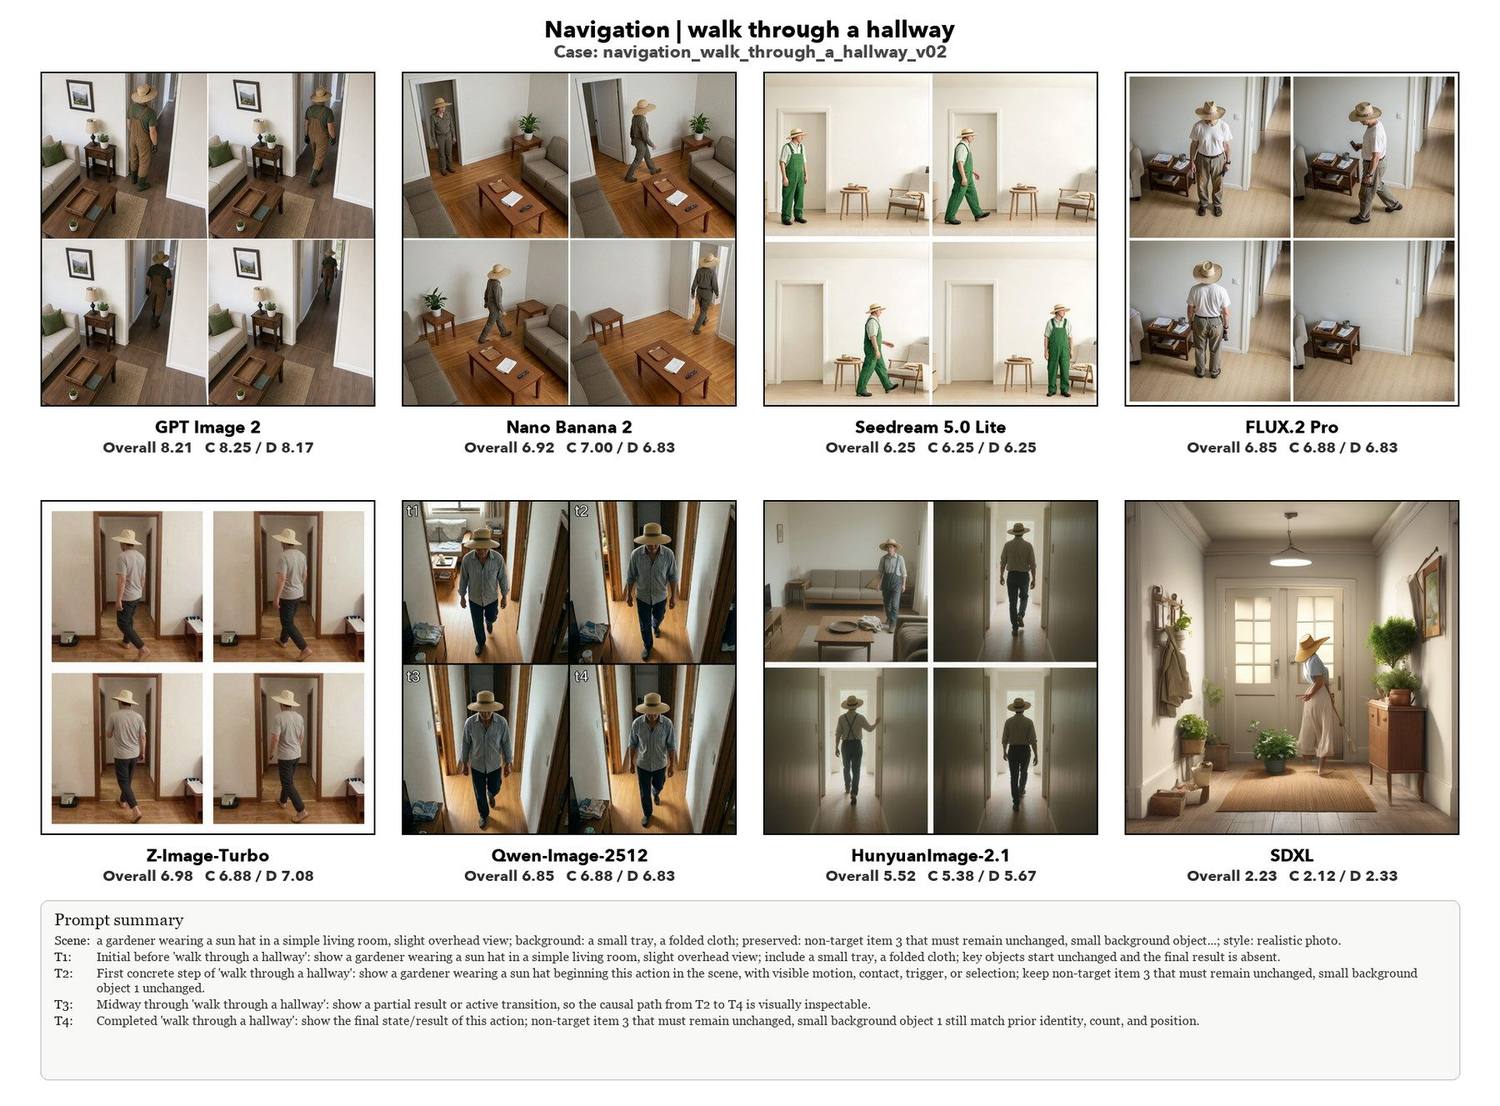
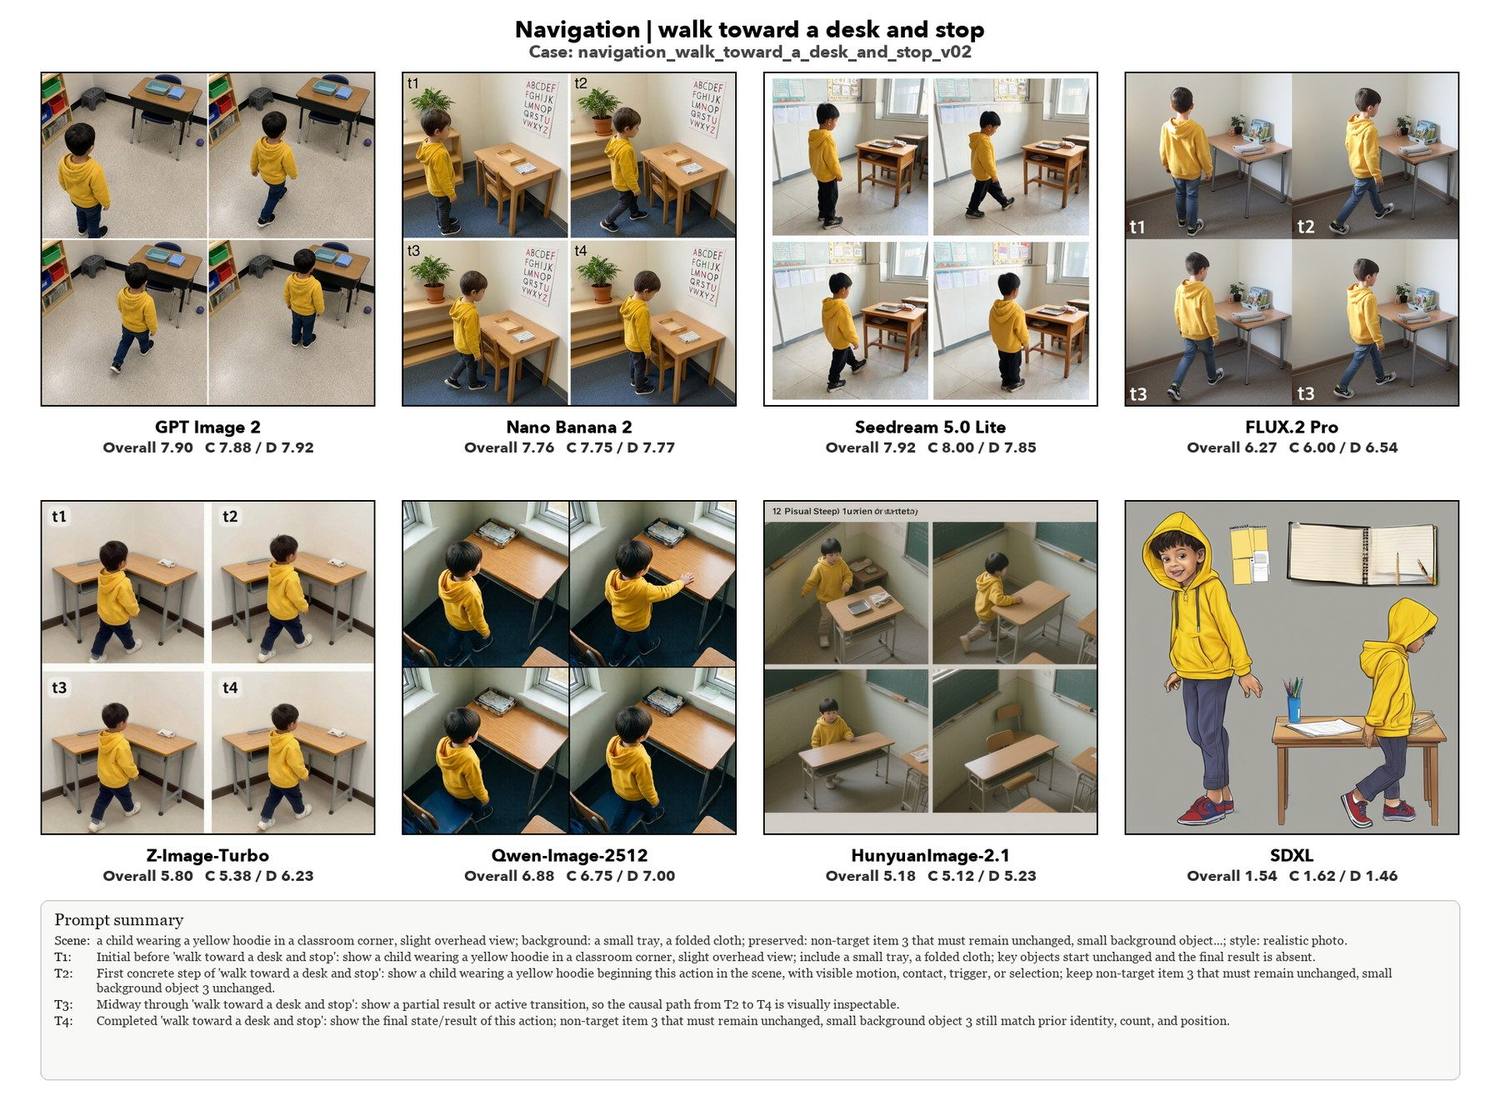
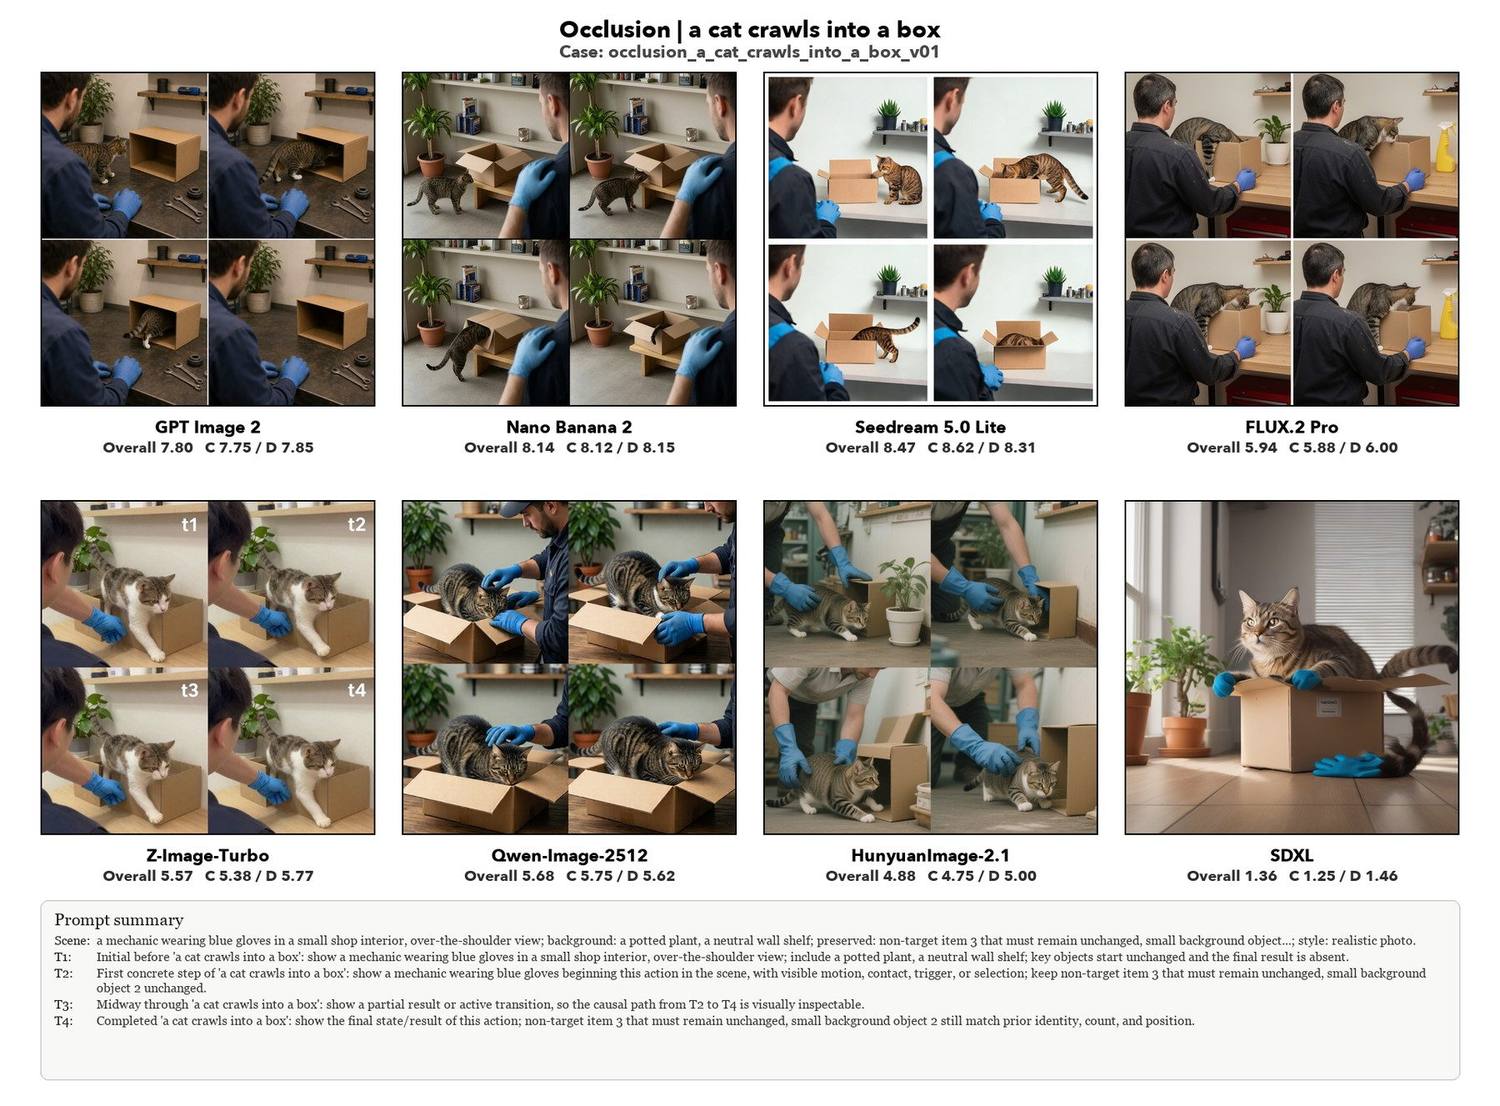
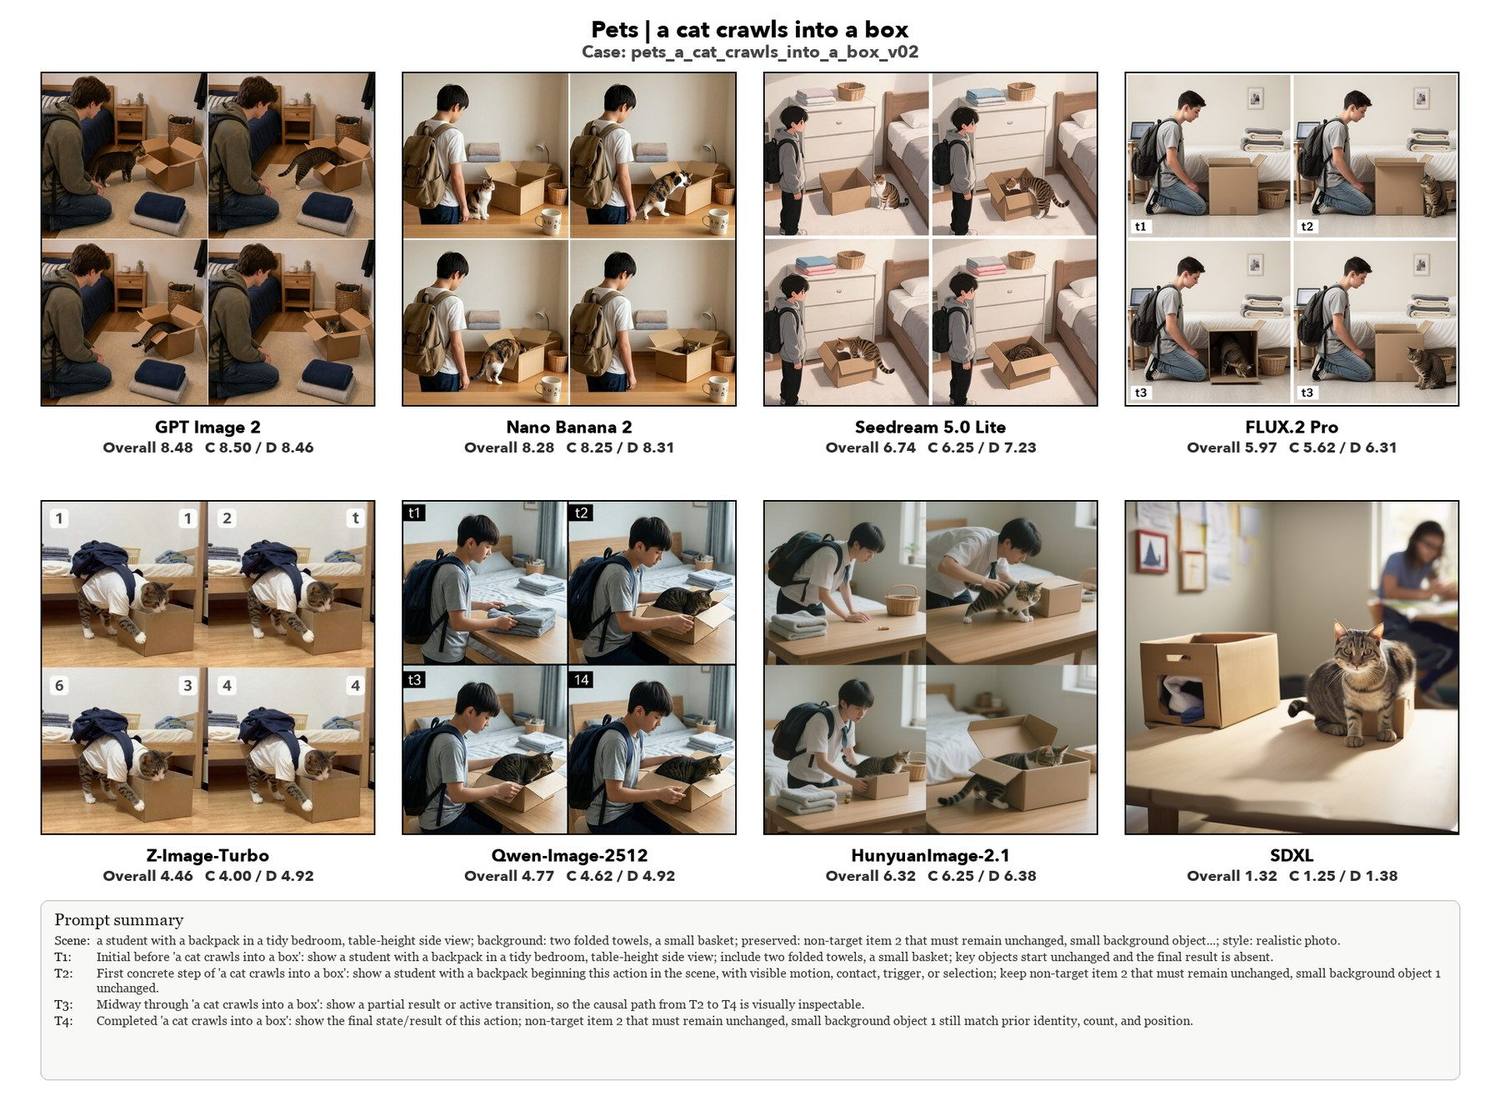
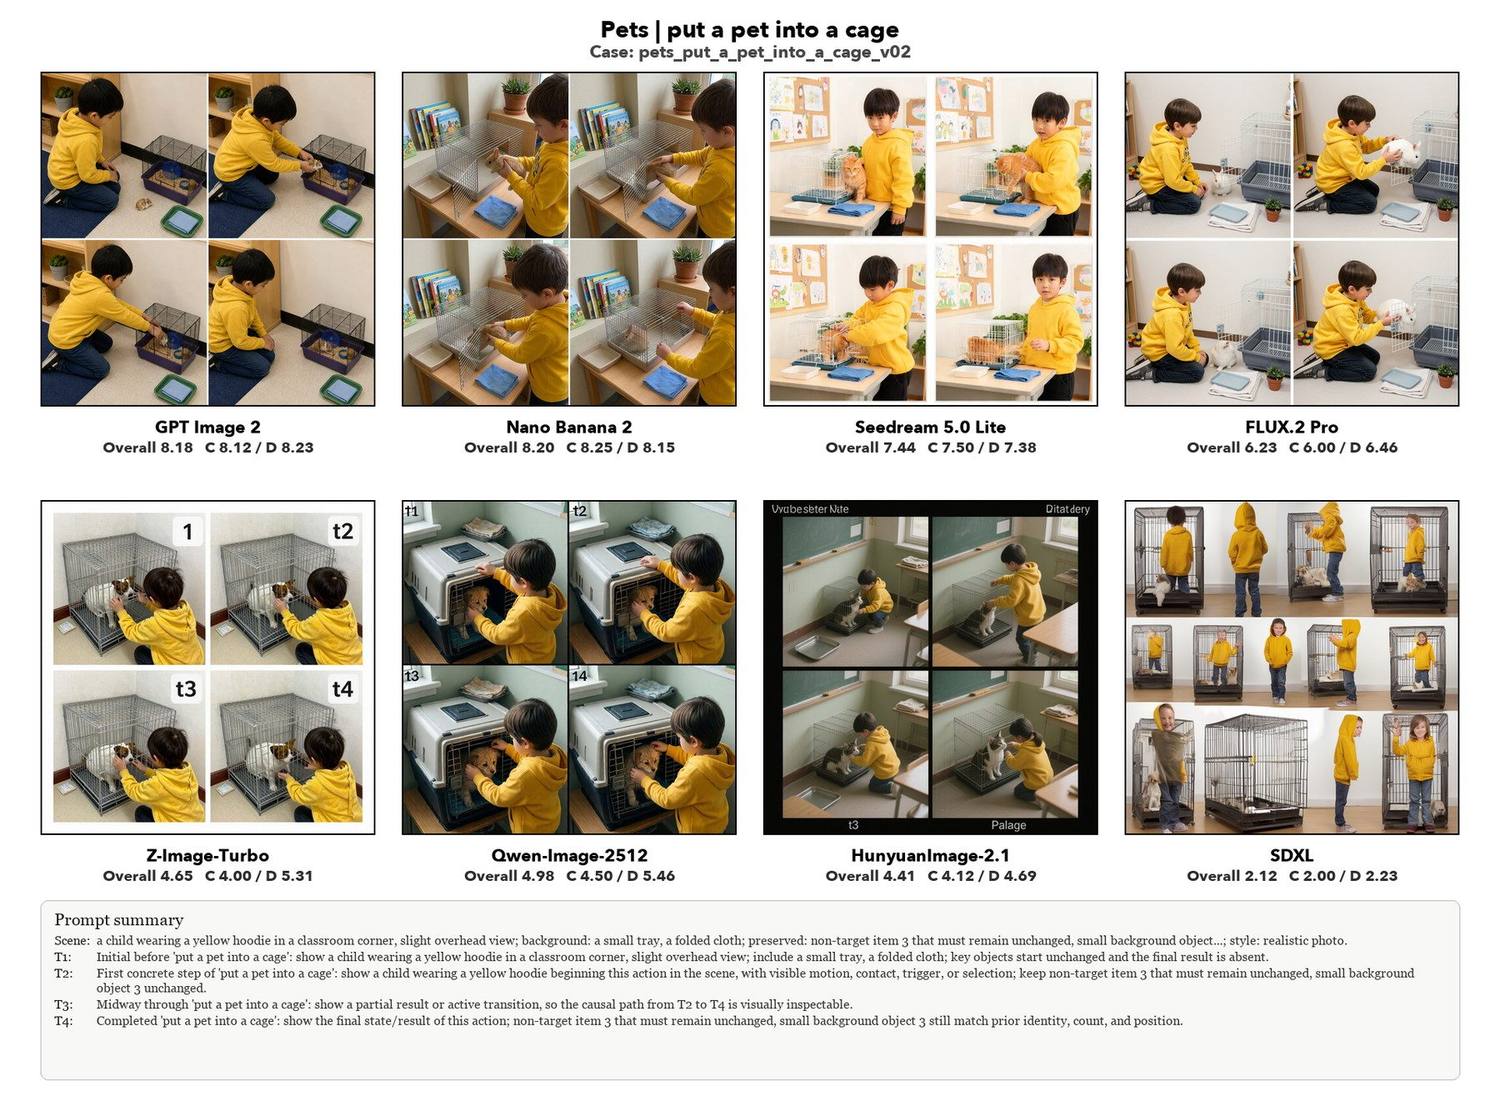
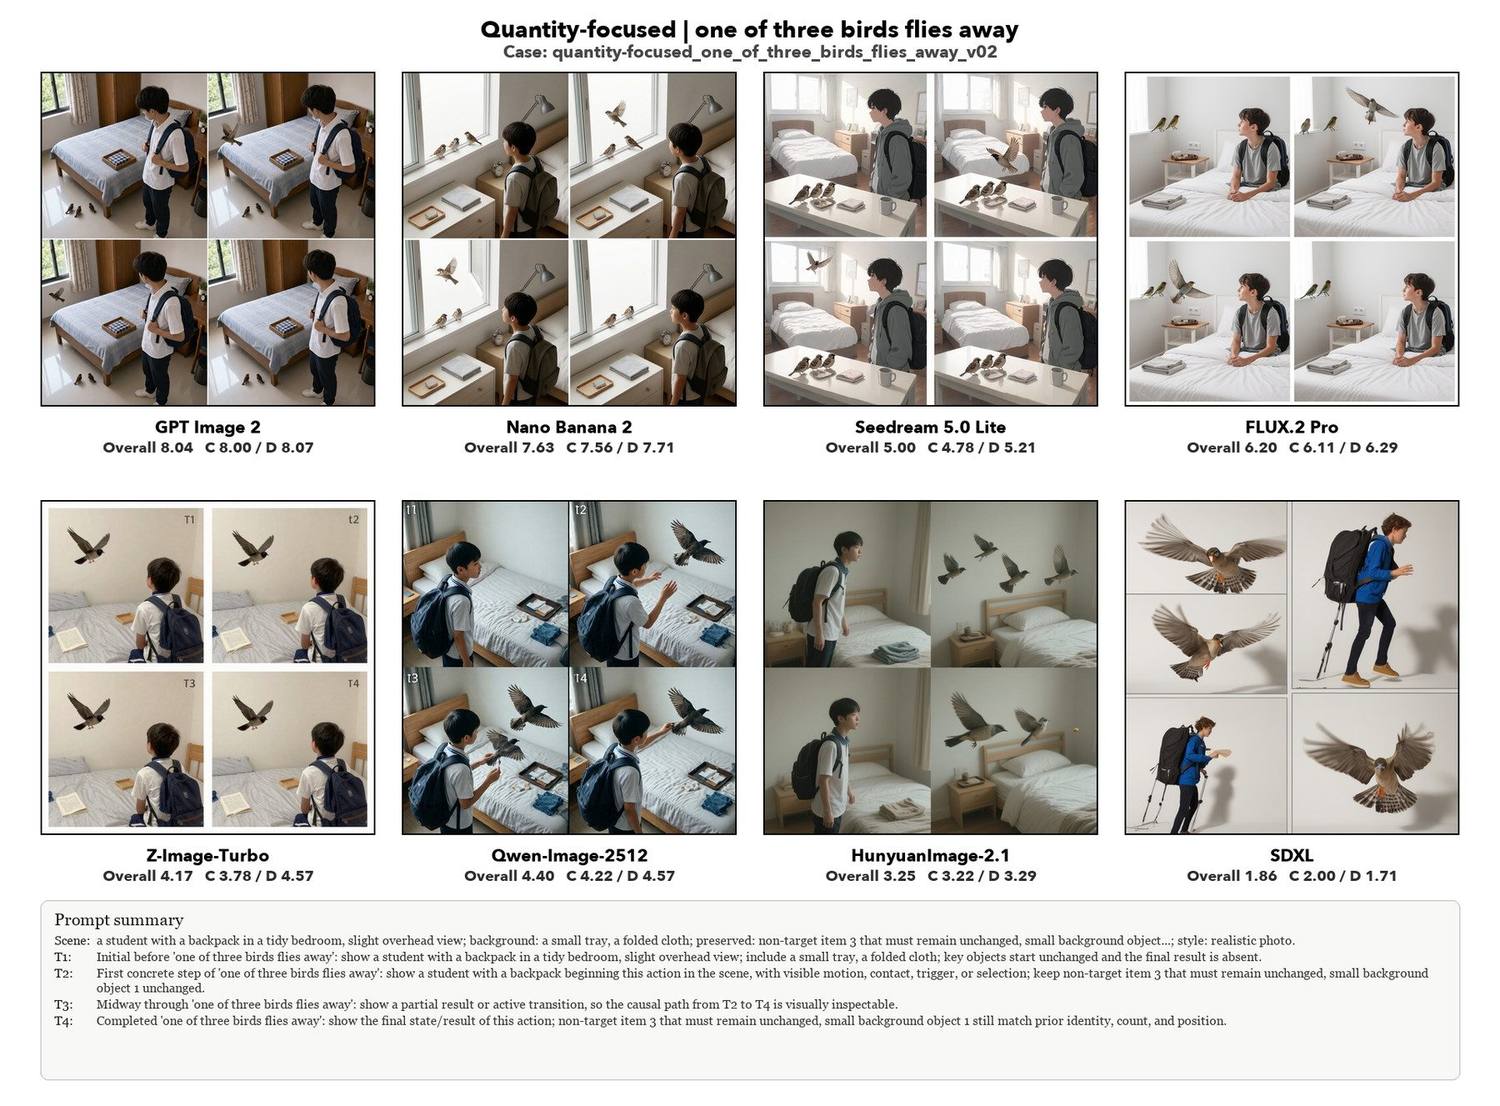
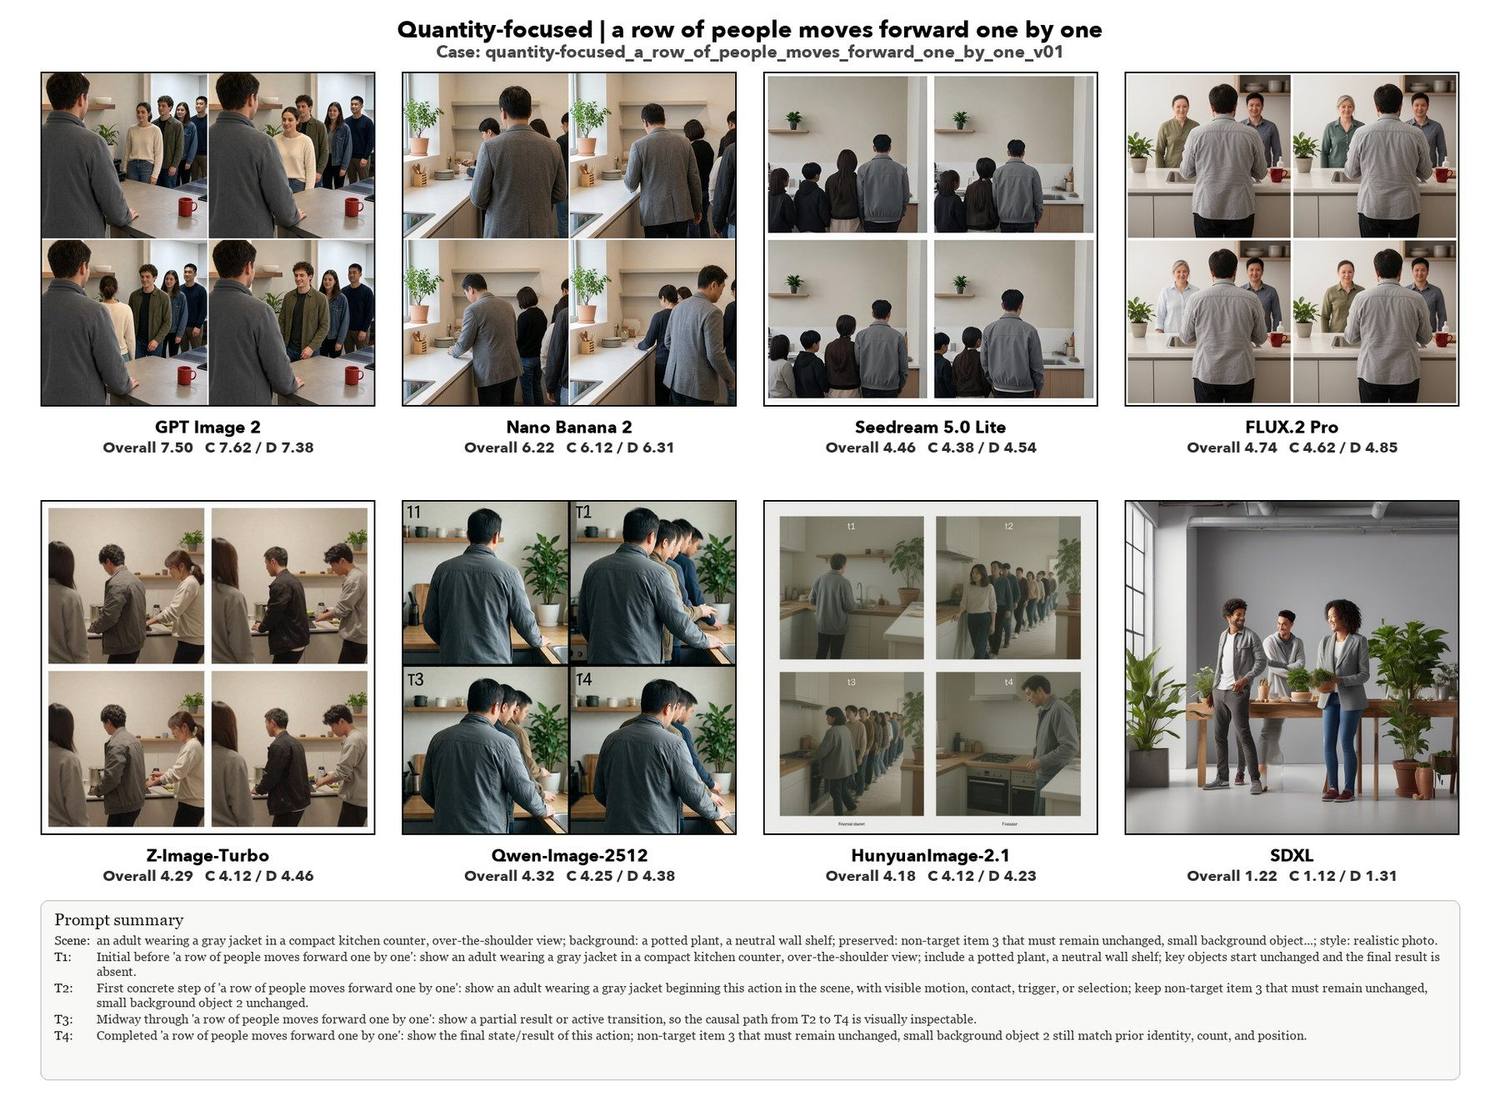
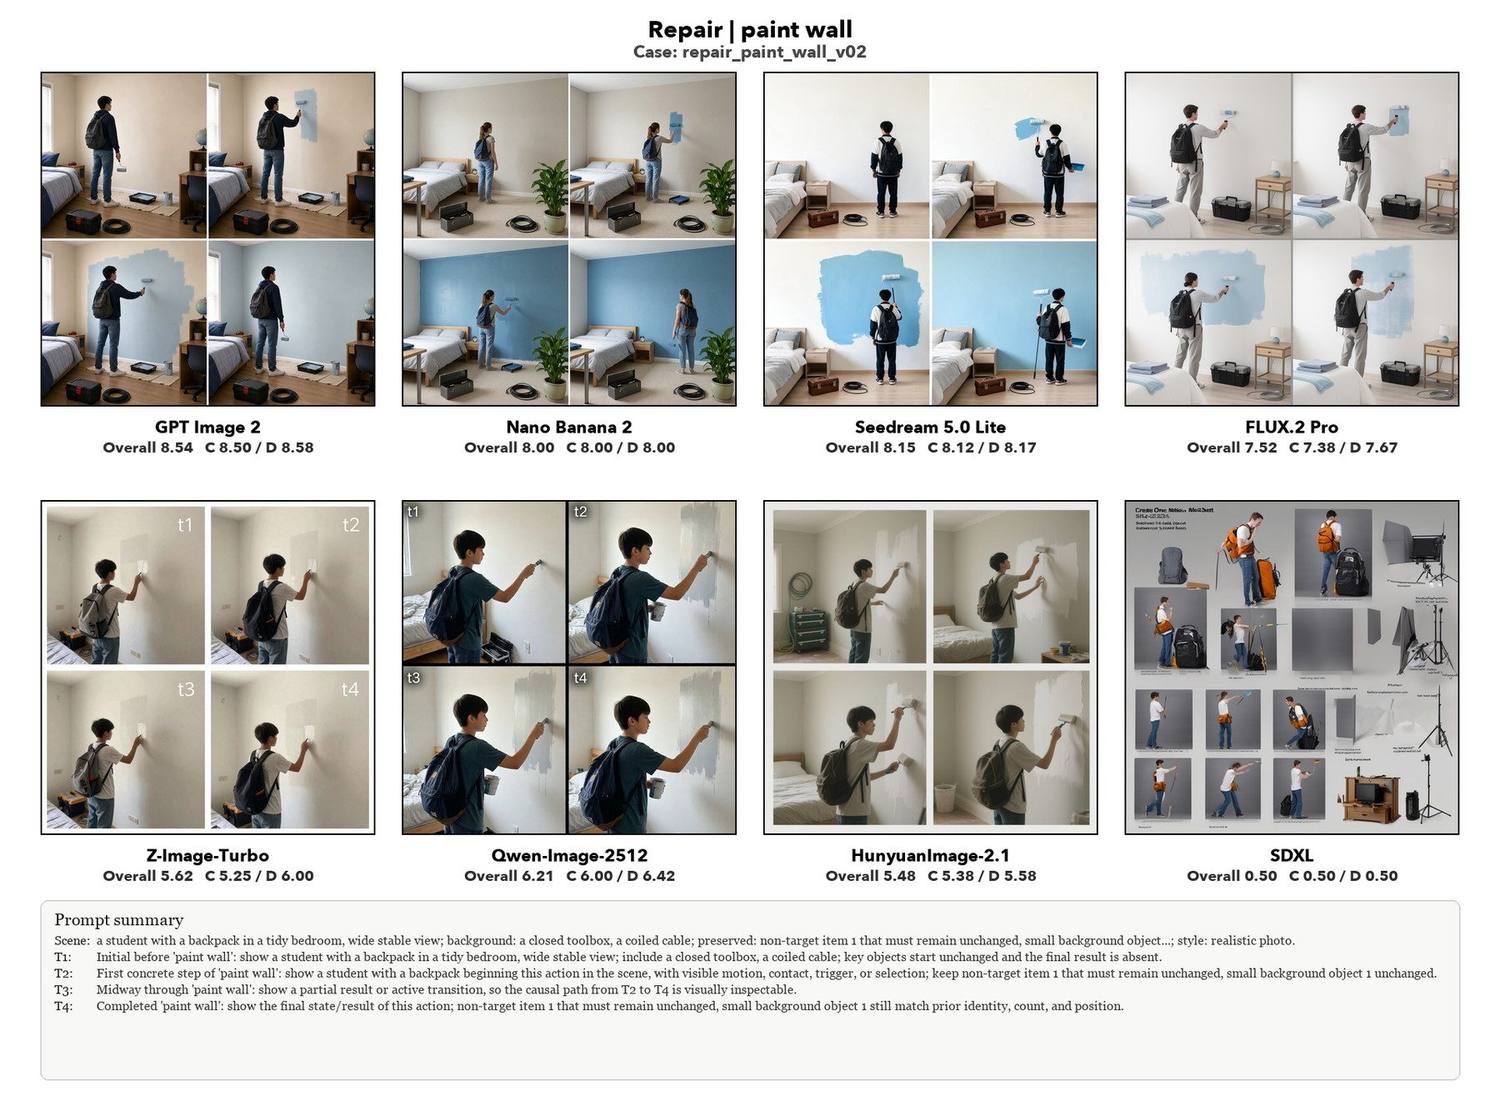
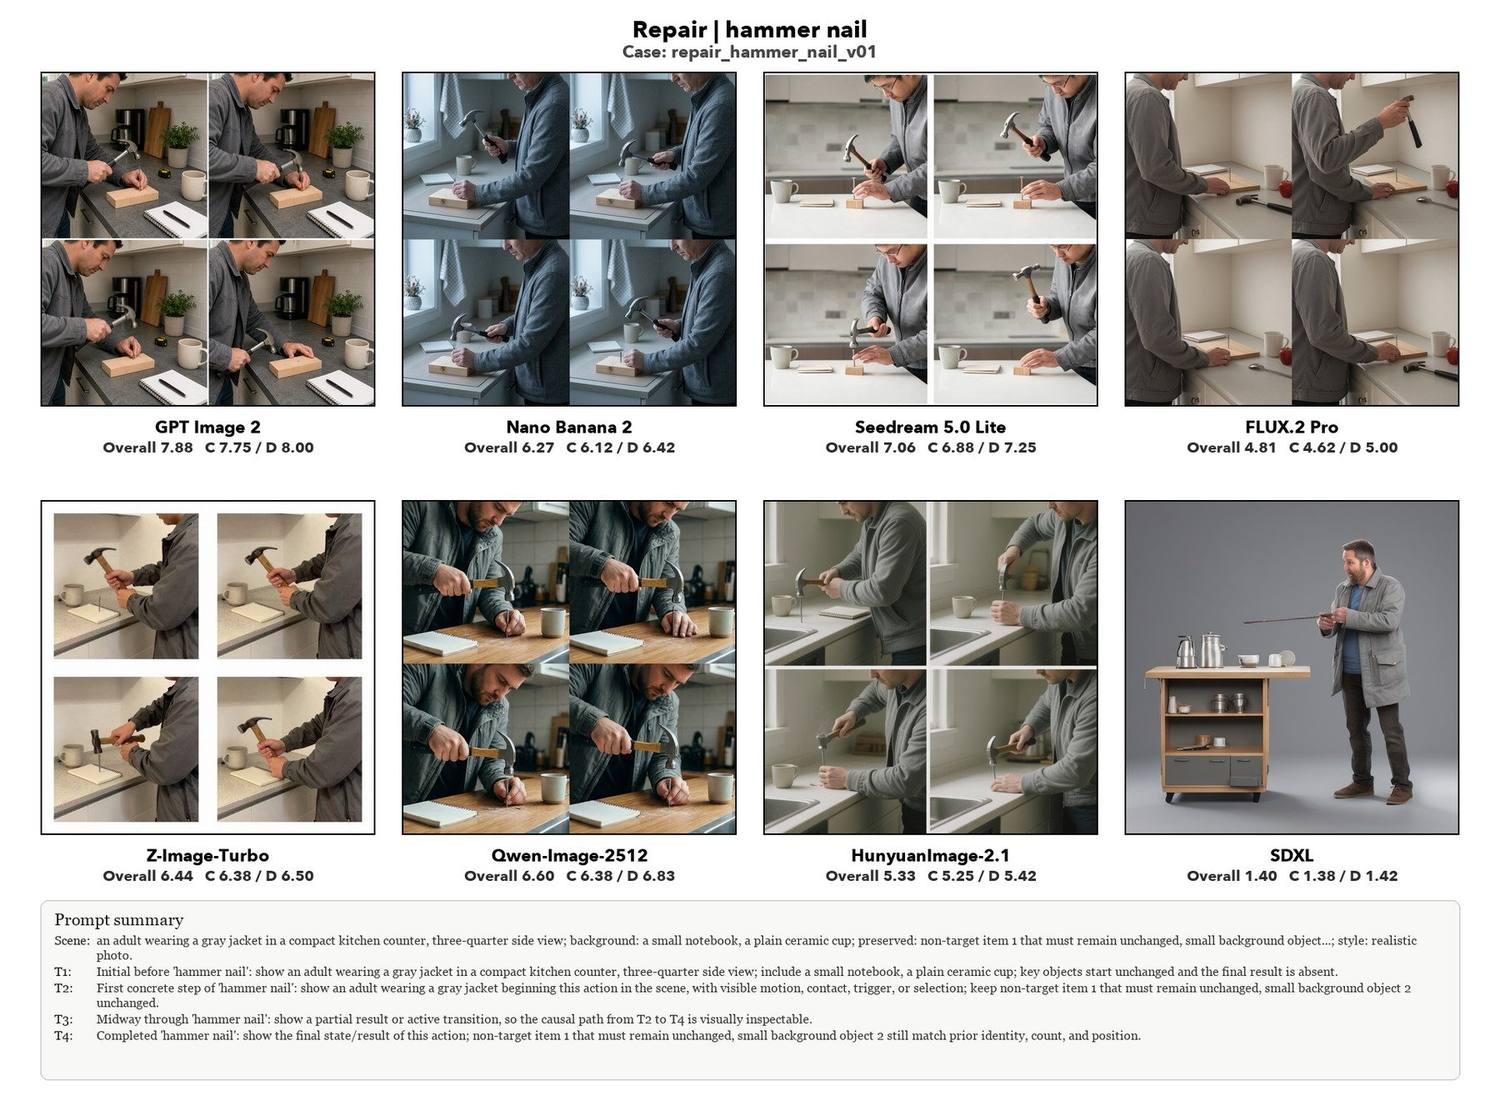
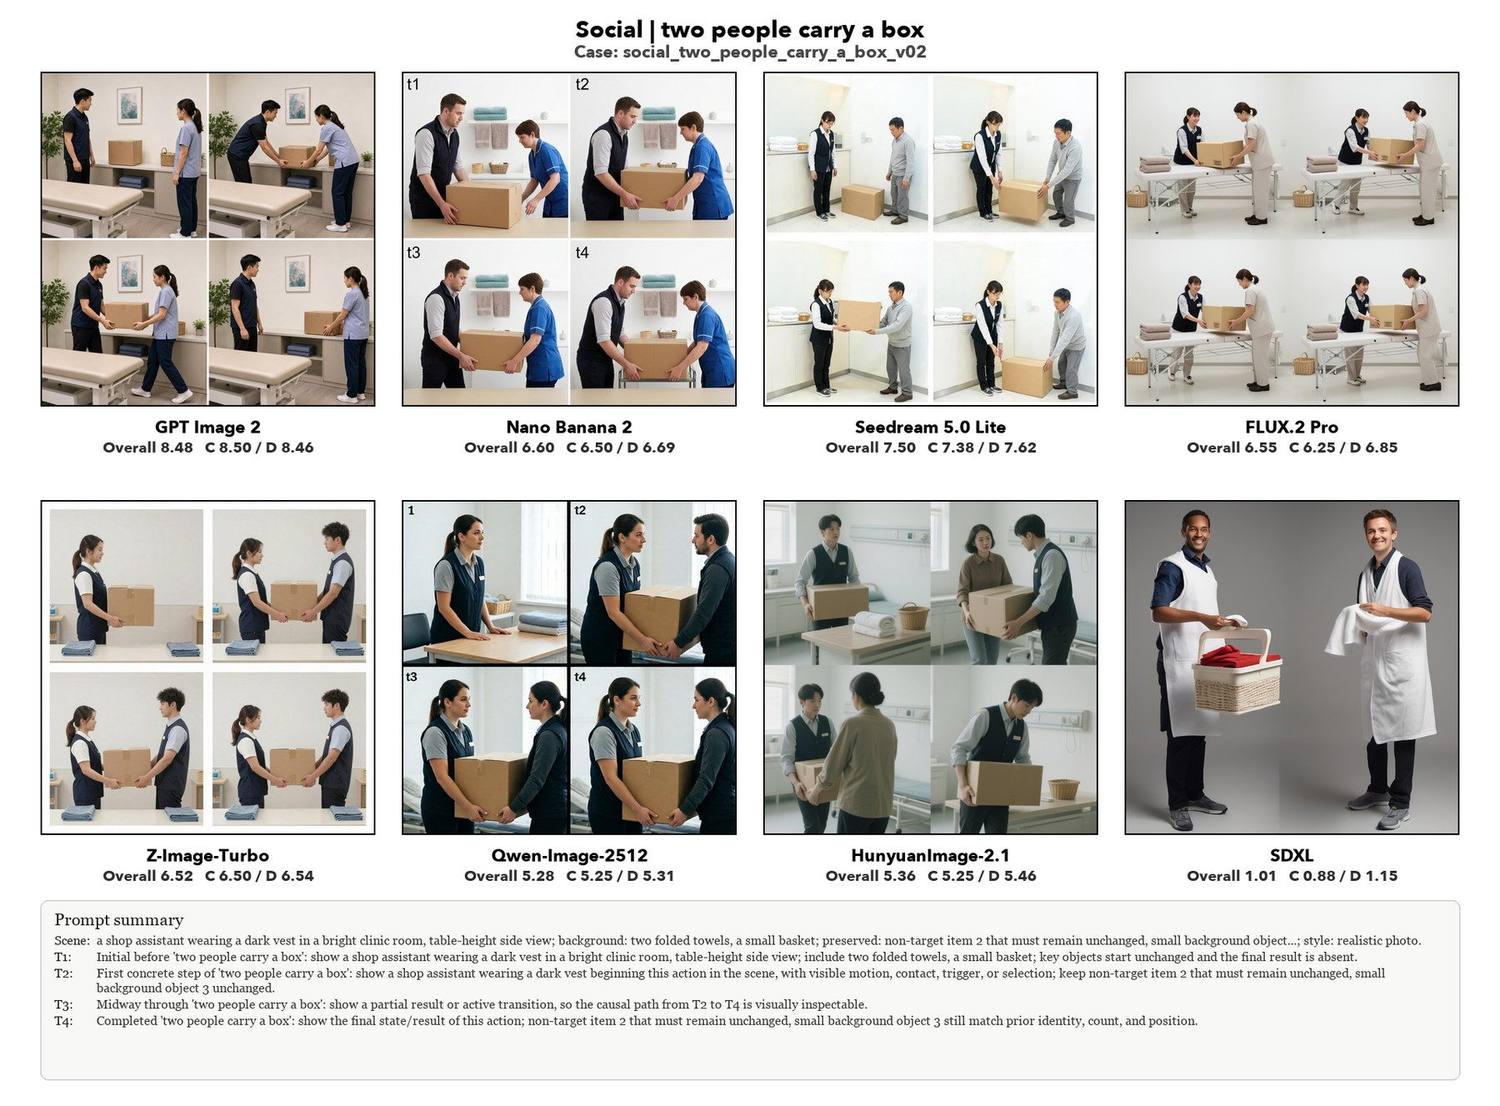
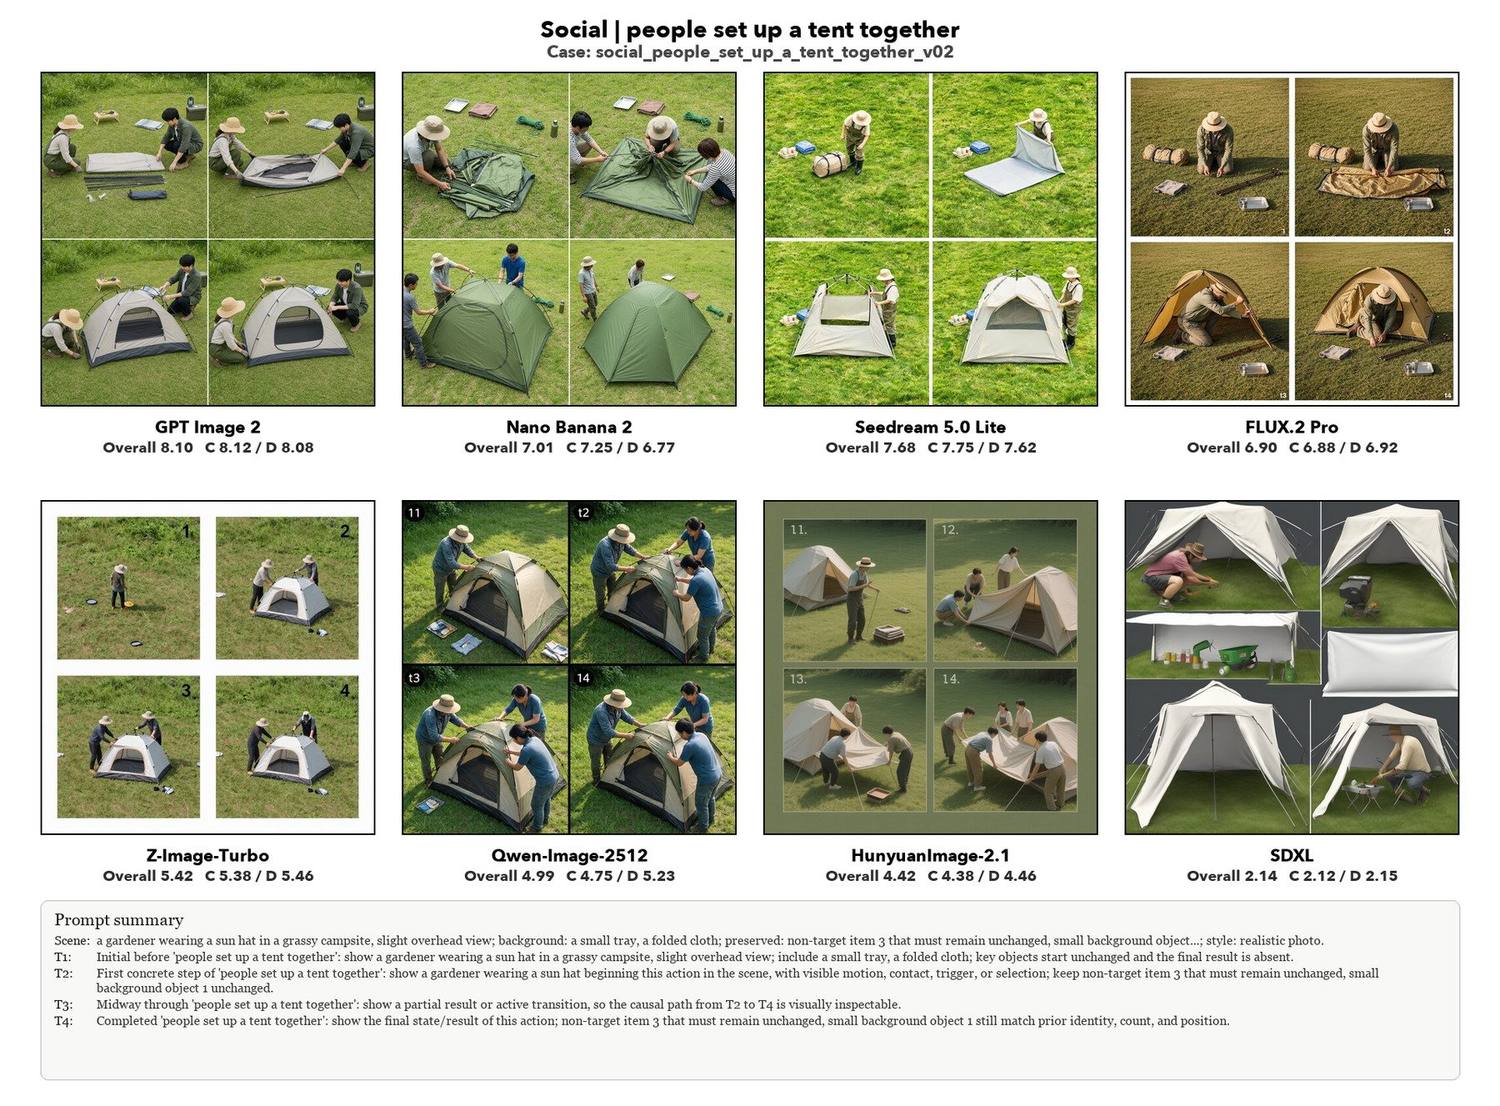
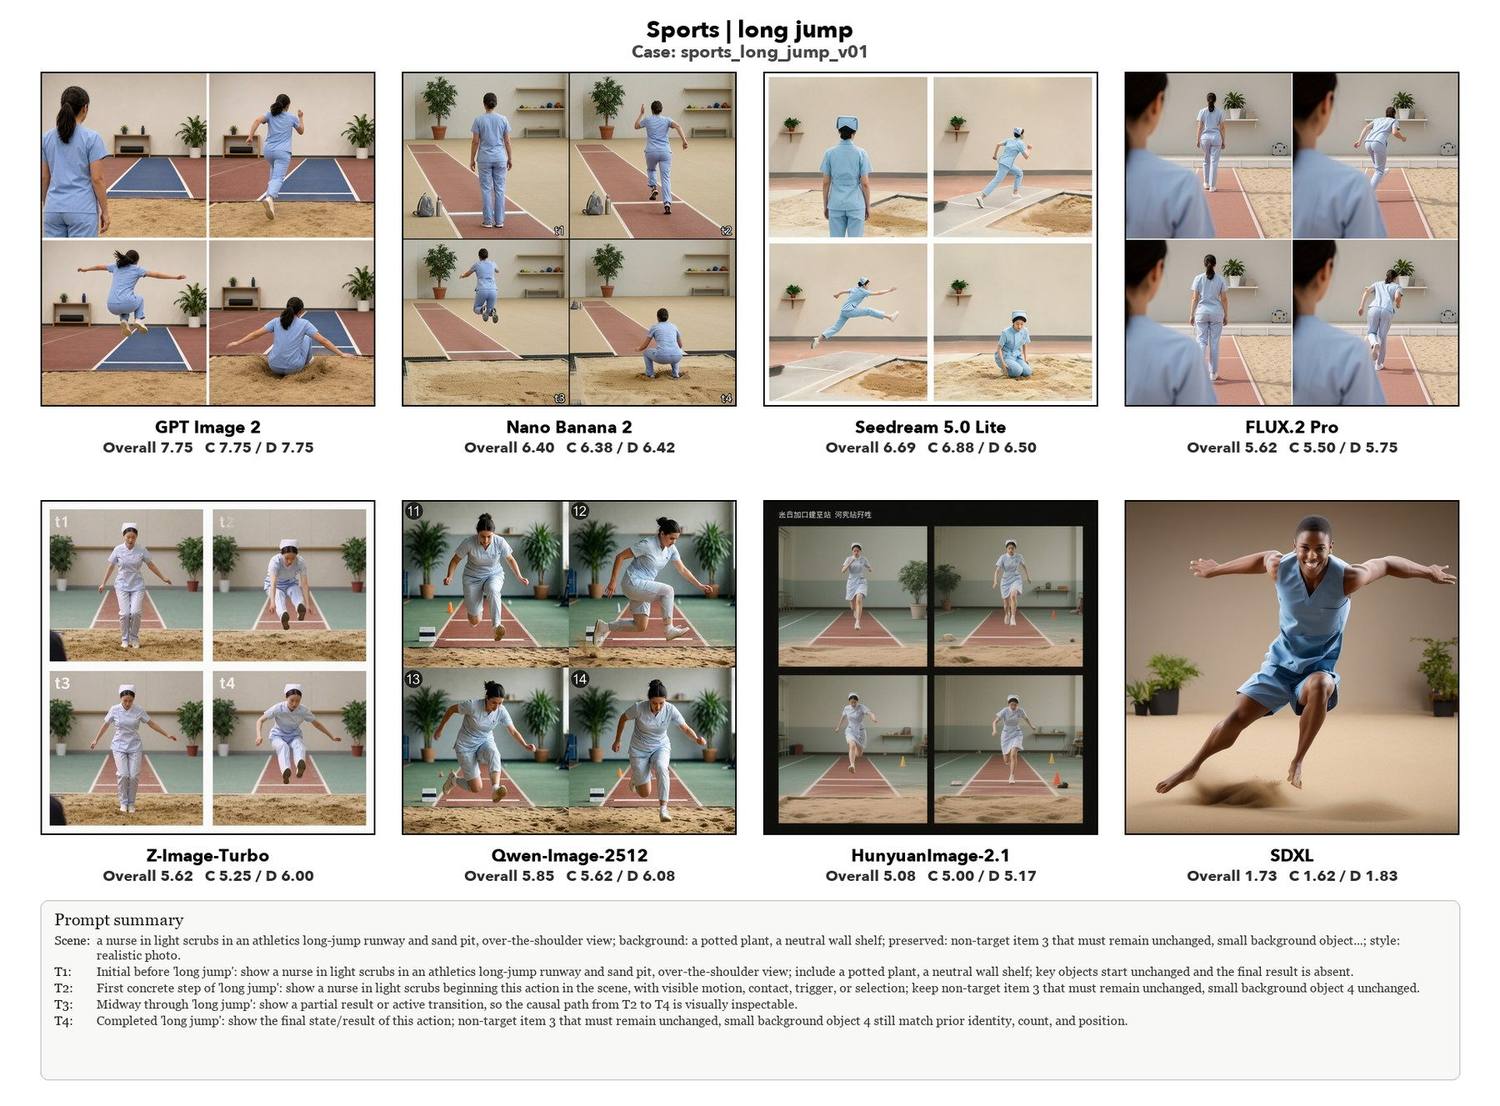
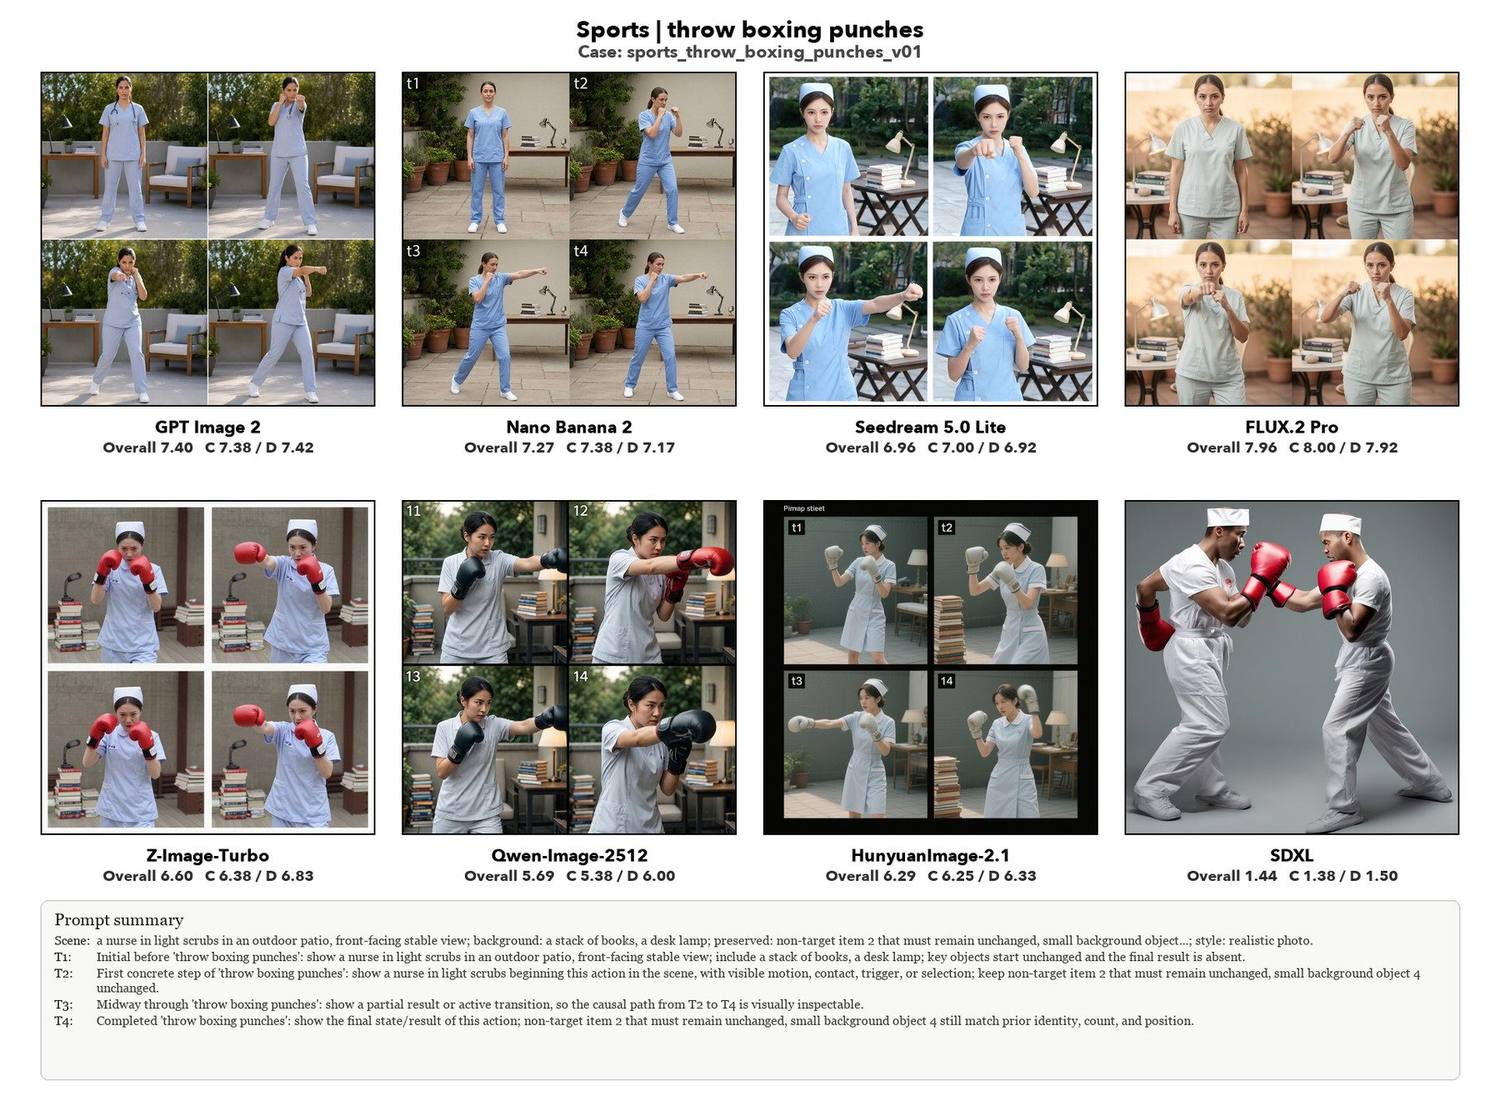
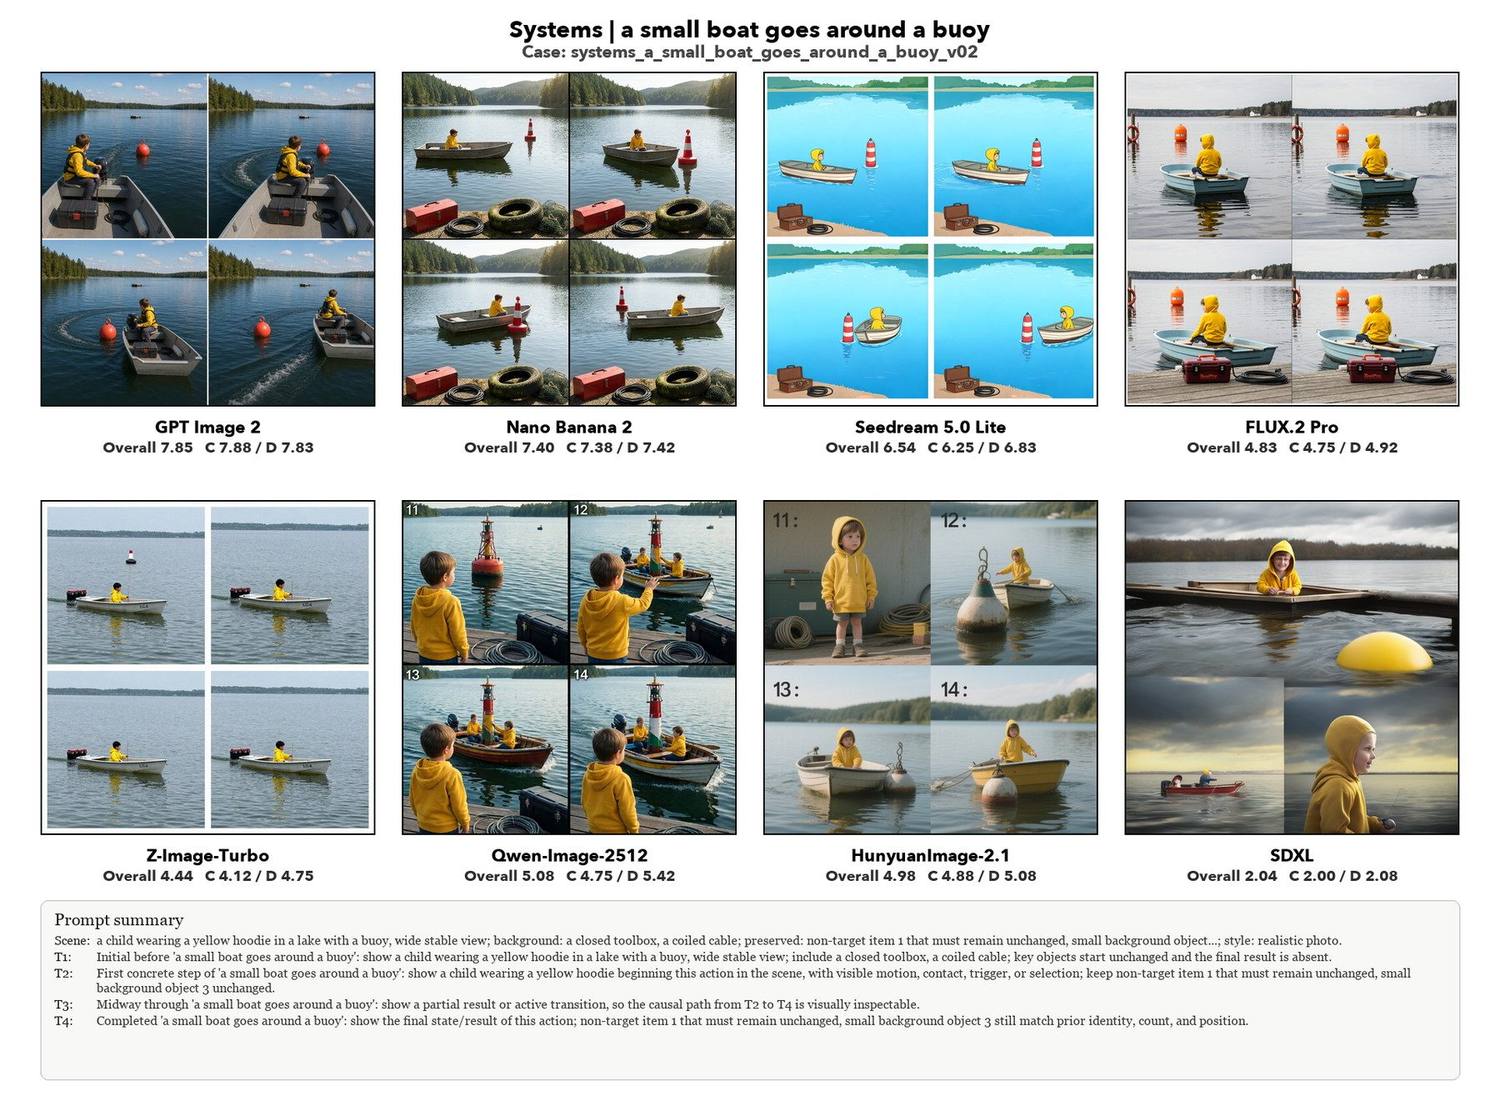
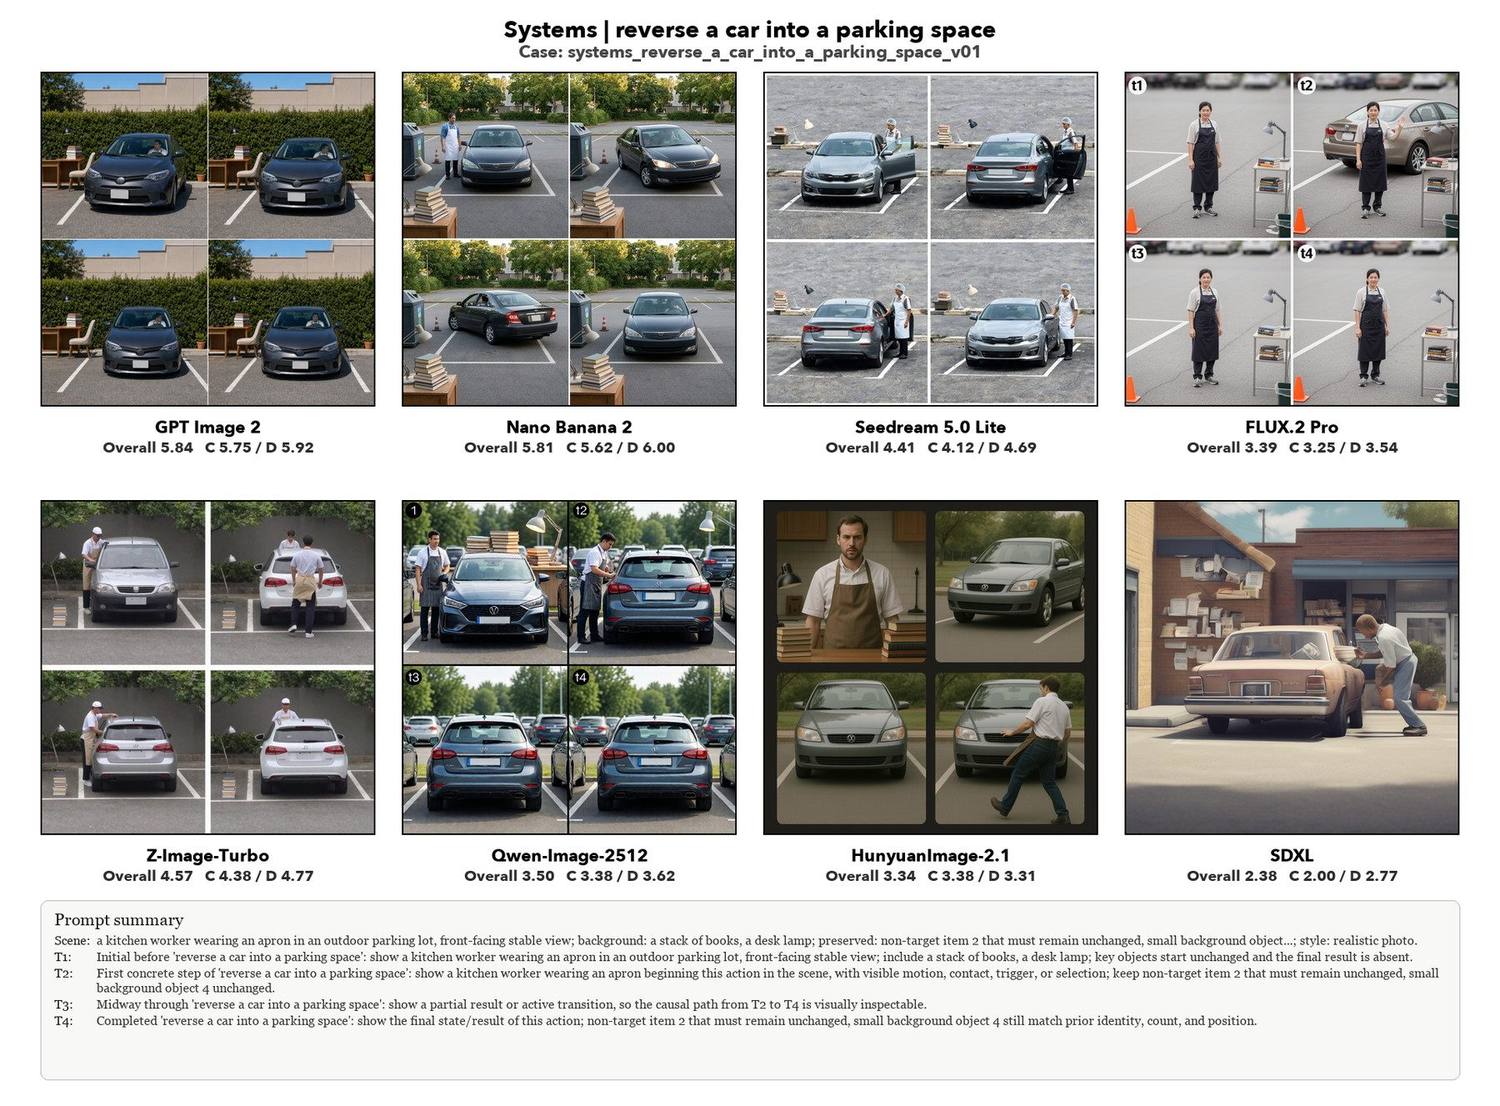
For one action, every model must draw its own 2×2 sheet. Strong models break the action into a coherent ordered process; weaker ones drift, repeat a stage, or collapse the layout. Below: all 22 domains, two examples each — 44 motion sheets, eight models per sheet. Filter by domain, click any image to enlarge.

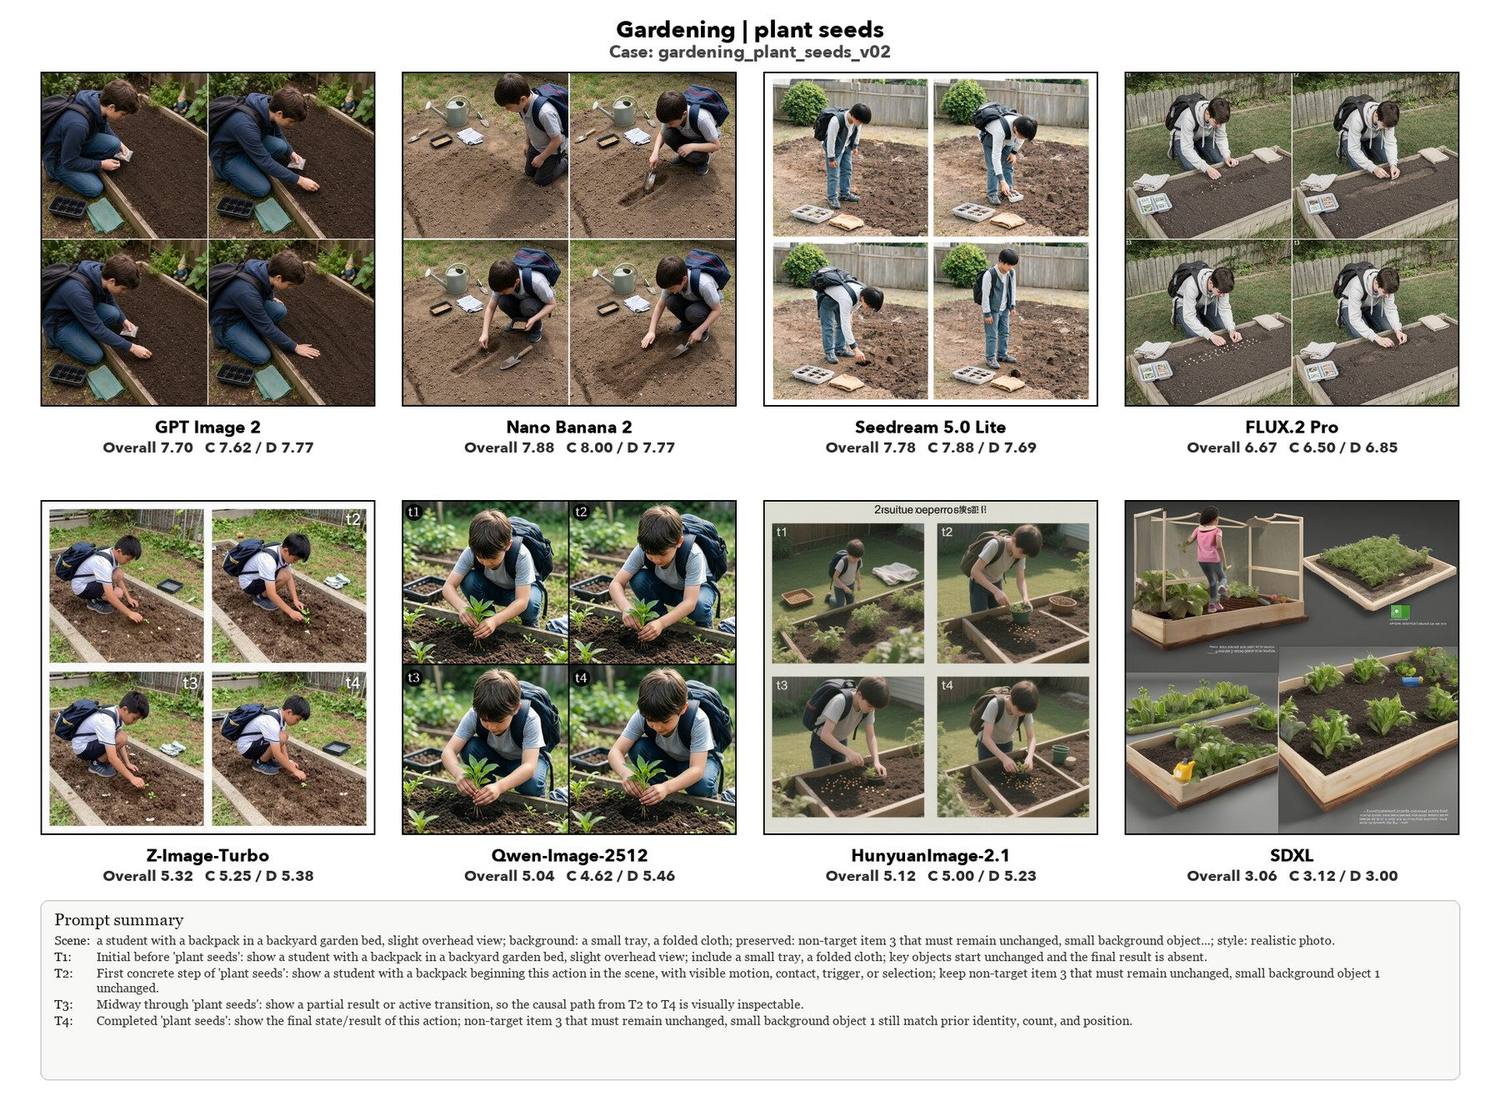
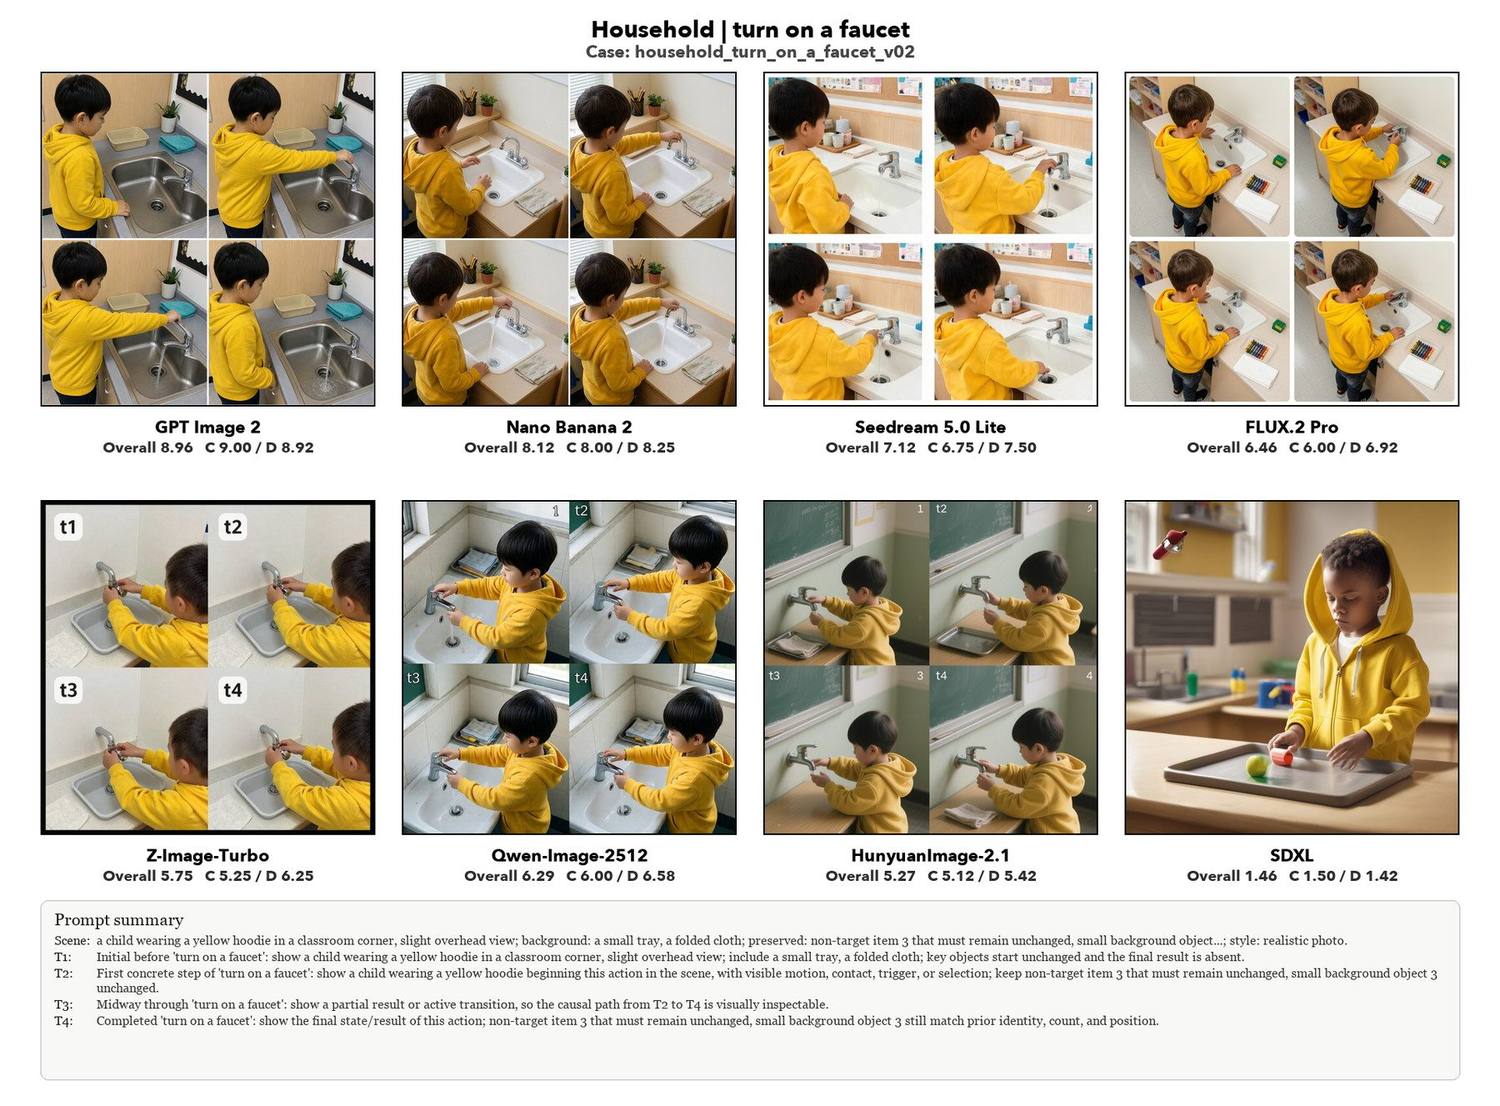
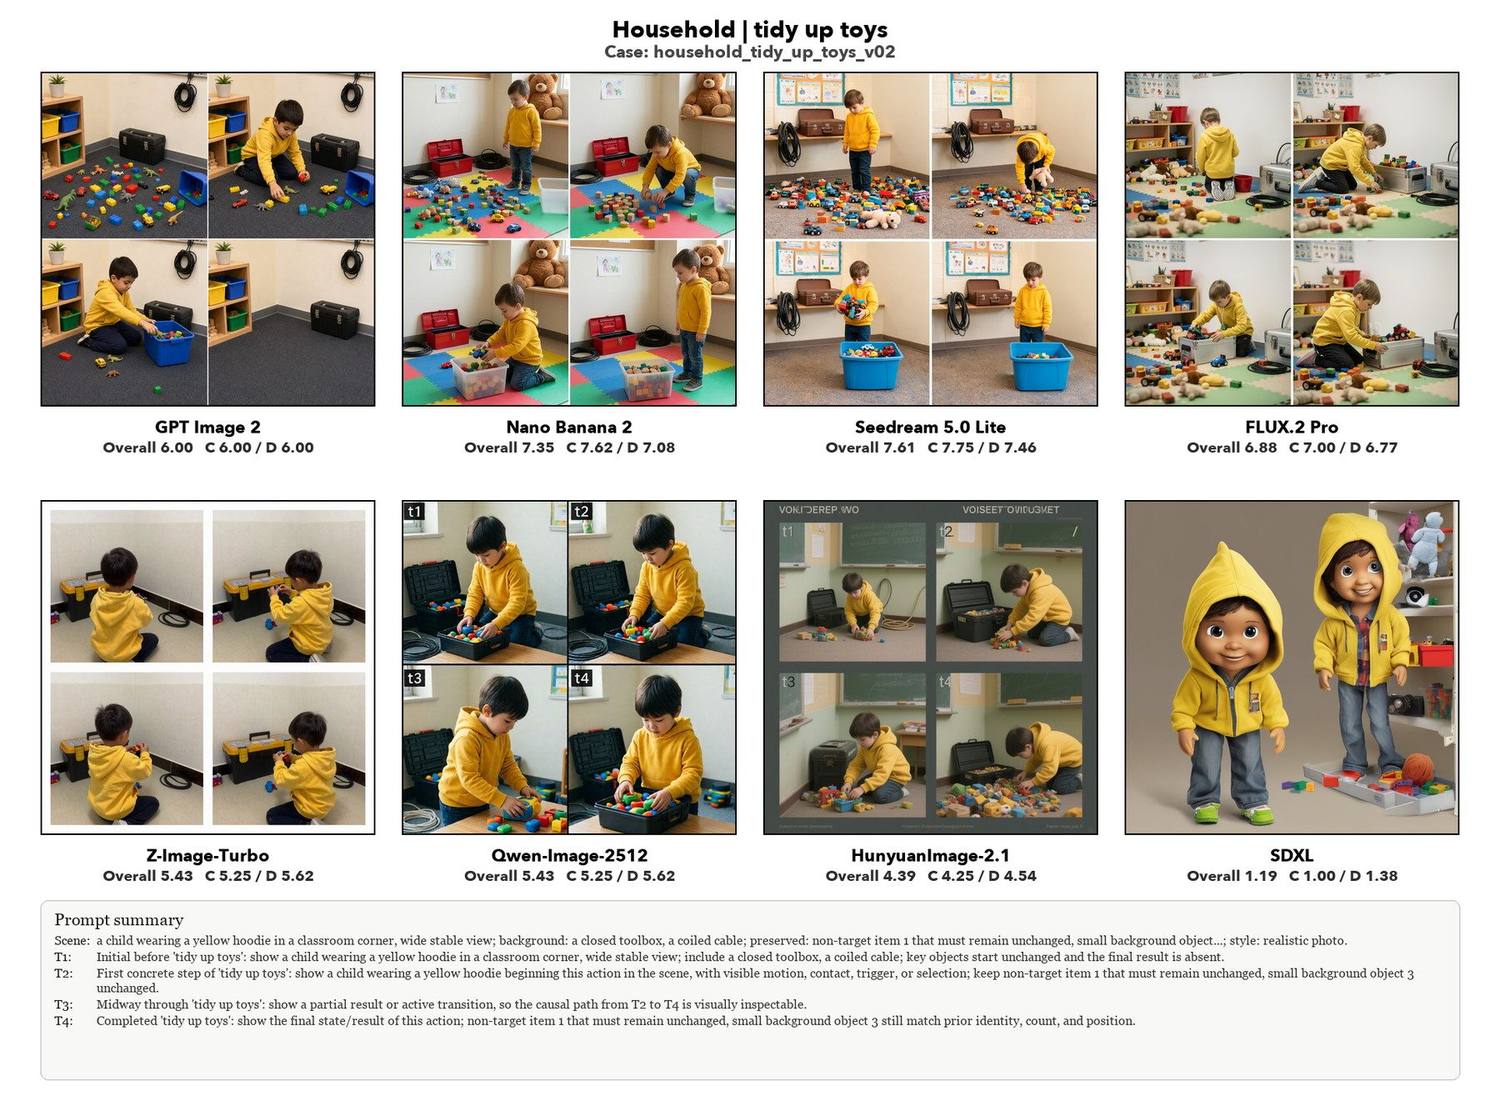
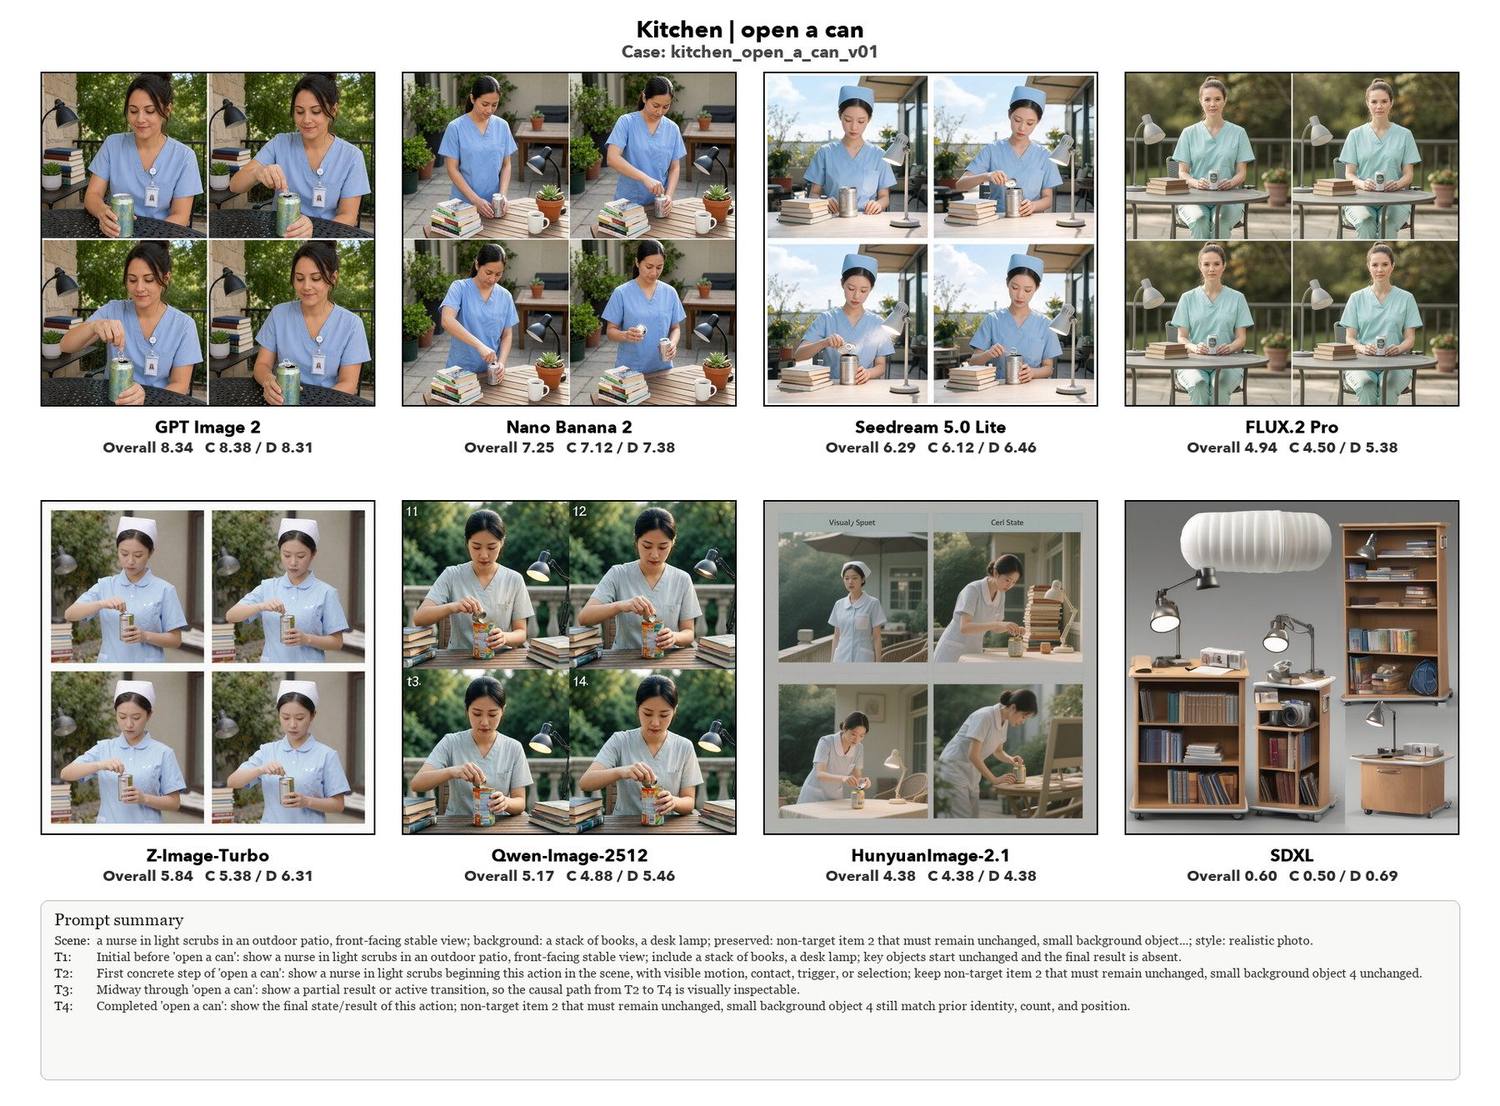
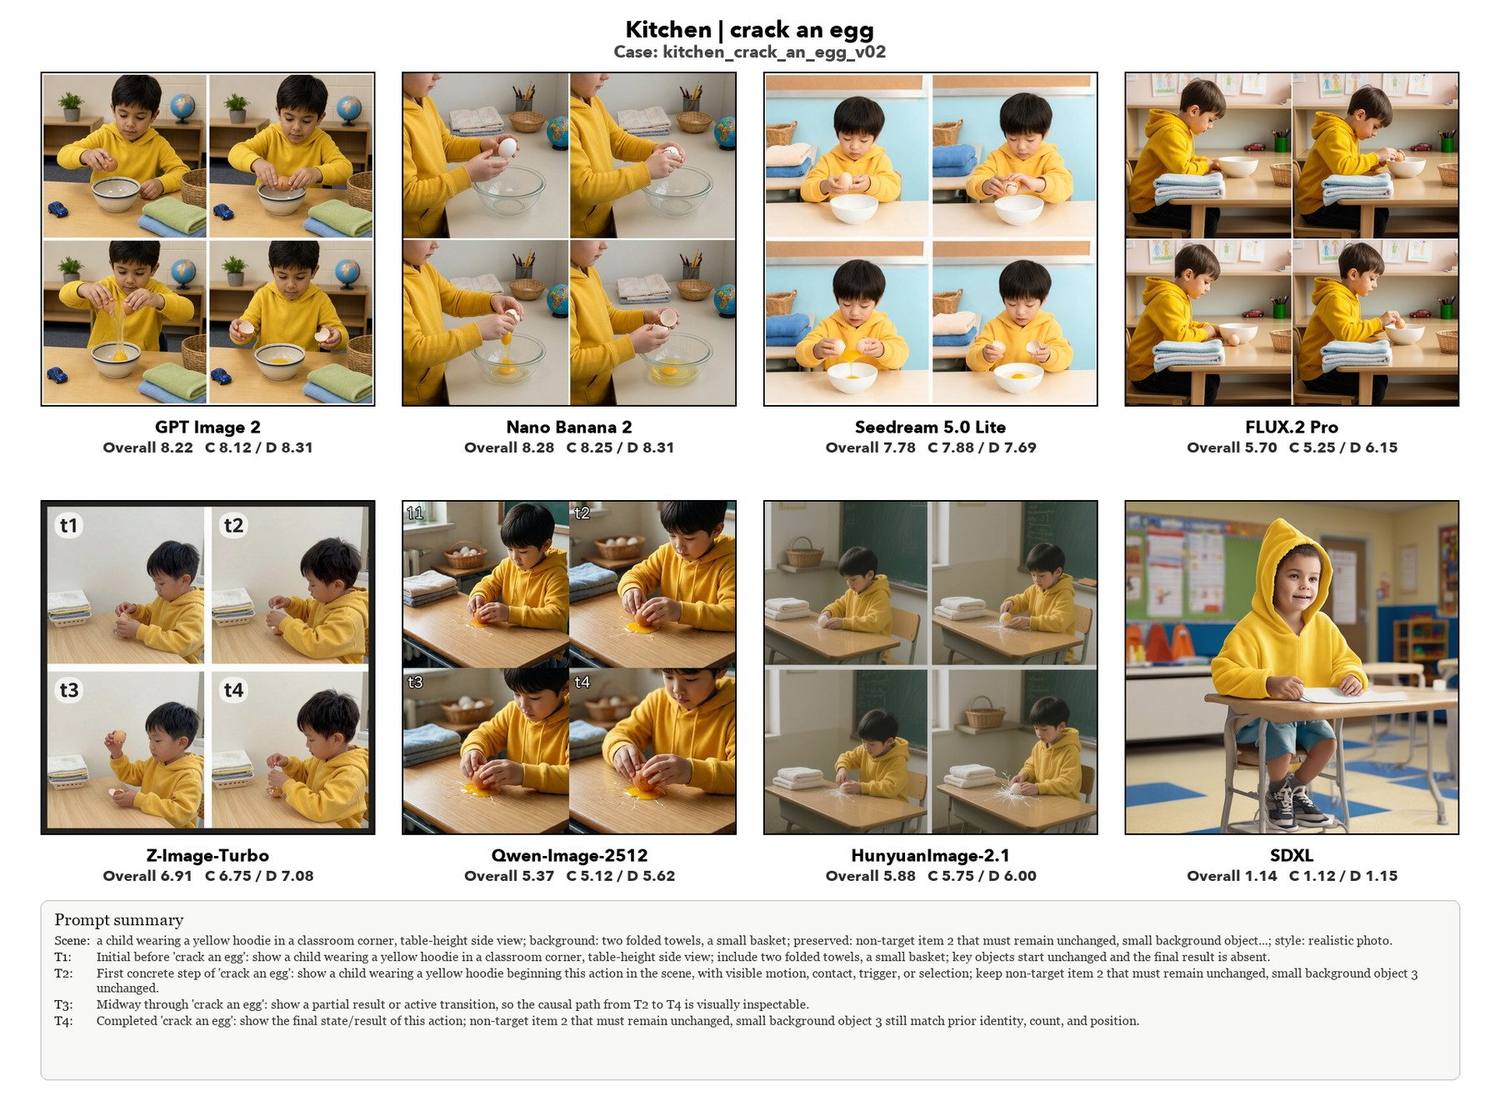
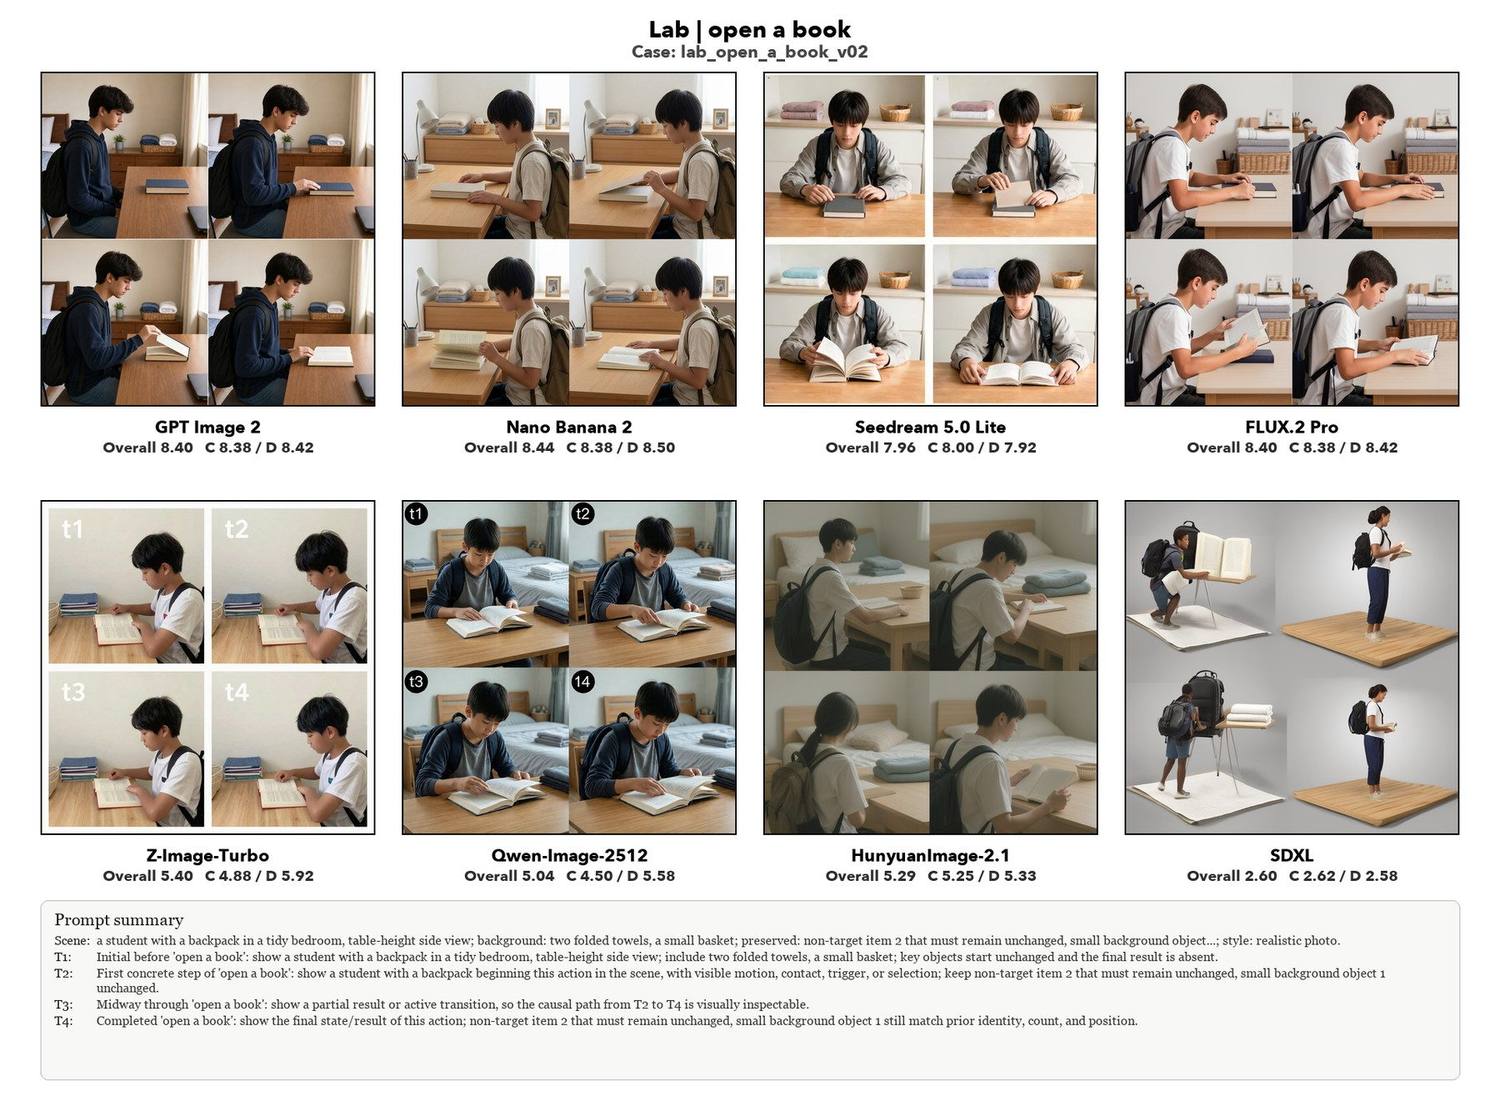
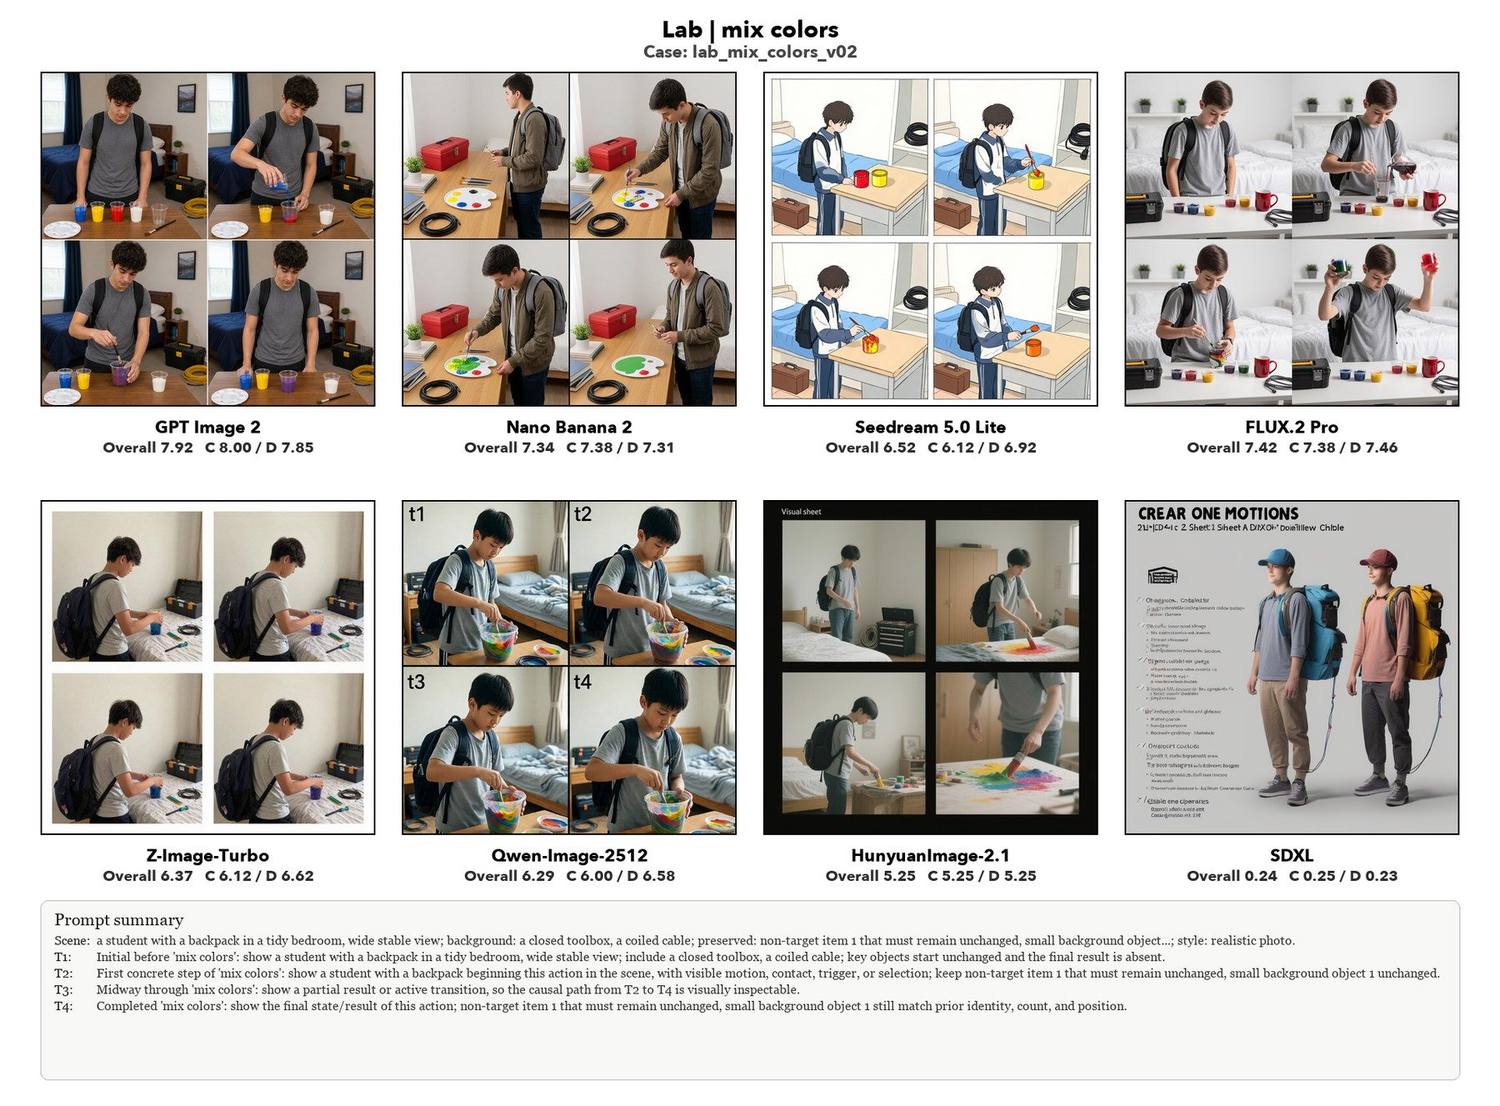
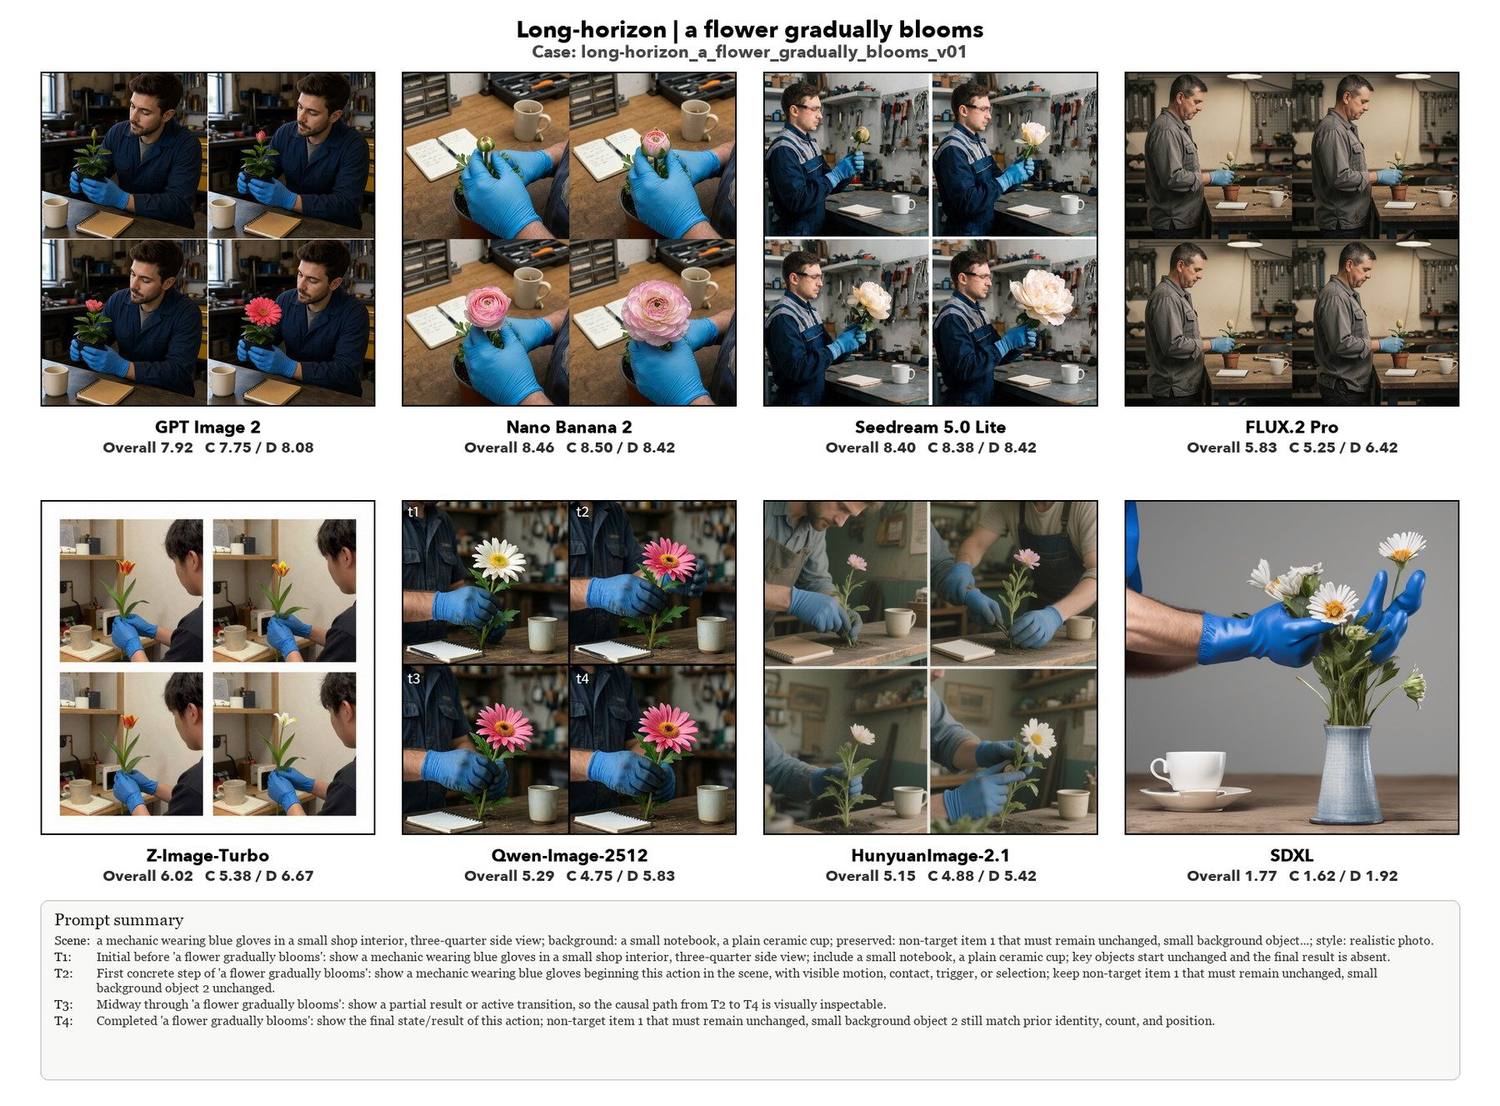

What it means
Your next-generation video model — need it even be a video model?
A careful caveat first: we don't claim to see a “world model” inside these networks. ImageTime is a behavioral probe — it watches whether world-model-like consistency is externalized into the generated image, not the internal representation.
Even so: if an image model can hold a single visual world across frames, understand object state change, and respect temporal and causal order, it becomes a lightweight way to express a visual process — storyboard keyframes, robotic action previews, low-cost process-level data.
Push the frame count high enough — 30, 60 cells — flip through them, and you've essentially assembled a video out of one image model's keyframes. Between image and video generation, perhaps only “frame count” remains.
Citation
Our data, generated images, judge scores and scripts are fully open. Check it, reproduce it, push back on it.
@misc{wu2026imagemodelsimaginetime,
  title        = {Can Image Models Imagine Time? ImageTime: A Novel Benchmark
                  for Probing Visual World Modeling Through Spatiotemporal Consistency},
  author       = {Xinrui Wu and Lichen Huang},
  year         = {2026},
  eprint       = {2606.10620},
  archivePrefix= {arXiv},
  primaryClass = {cs.CV},
  url          = {https://arxiv.org/abs/2606.10620}
}